
SASLab Manual
| |
Main window : Edit > Filter > Frequency Domain Transformations
|
|
The Frequency Domain Transformations tool allows filtering marked subsections of a sound file in the frequency domain using fast Fourier transformation (FFT). It is therefore necessary to mark the desired subsection before applying this filter tool. The marked section is first transformed into the frequency domain and the filtering is done by multiplying the spectrum by the transfer function and finally calculating the inverse Fourier transformation. The behavior of this filter type (regarding the phase response) is comparable to the FIR filters.
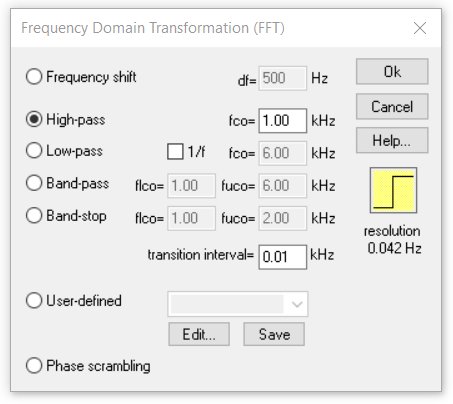
Frequency shift
The marked section is shifted in frequency by the specified value. Positive values shift the signals towards higher frequencies, while negative values shift them to lower frequencies. Note that this is an additive frequency shift, which means that the harmonic structure of multi-harmonic signals will not be preserved.
High-pass
The marked section is high-pass filtered using the specified cut-off frequency. Signal components below the cut-off frequency will be removed.
Low-pass
The marked section is low-pass filtered using the specified cut-off frequency. Signal components above the cut-off frequency will be removed.
The option 1/f will instead activate a special low-pass characteristic that applies an attenuation of 3 dB / octave (= 10 dB / decade) starting at the entered cut-off frequency.
This option can be used to convert white noise (created via Edit > Synthesizer) into pink noise.
Band-pass
The marked section is band-pass filtered using the specified cut-off frequencies. Signal components below the lower cut-off frequency and above the higher cut-off frequency will be removed.
Band-stop
Signal components between the specified lower cut-off frequency and the higher cut-off frequency will be removed.
The cut-off frequencies can alternatively be specified by the measuring cursors of the spectrogram or the curve window. To do this the filter dialog box must be launched and the measuring cursors in the spectrogram or curve window must be moved to the desired location. The numeric value of the cursor is then entered automatically into the filter dialog box.
transition interval
This parameter determines the width of the transition interval between the pass and stop band of the filter. Steep transitions can cause undesired ringing (oscillations at the corner frequencies). It is therefore recommended to enter a value larger than zero because smother transitions will reduce these ringing artifacts.
User-defined
This option allows selecting a predefined frequency response for filtering the marked section.
The desired frequency response must be defined in a .flf file. In this ASCII-formatted file an unlimited number of coordinate pairs [frequency Hz] [attenuation factor] define the desired frequency response. The frequency is specified in Hertz. The corresponding attenuation factor is a value between zero and one. It can be advantageous to edit this file in a spreadsheet application.
This is a sample of a .flf file (see also the file demo.flf in the SASLab Pro program folder):
100 0.1
200 0.3
500 0.3
2000 0.8
4000 0.1
6000 0
20000 0
Alternatively, the attenuation can also be defined in dB units (the software will interpret the data set as logarithmic dB values as soon as there is at least one negative number or the maximum is not larger than 0.0).
The Edit button below allows editing the selected frequency response file graphically. A new frequency response file can be created by entering a new file name (extension .flf). The shape of the requency response can be edited by mouse drawing within the curve window that is launched. Existing points can be moved by left clicking and dragging them to a new location. A point can be removed by right clicking on it.
The entire shape can be removed from the drop-down menu option Edit > Reset Frequency Response of the curve window.
The entire frequency response can be inverted from the drop-down menu option Edit > Invert Frequency Response or normalized to 1.0 from Edit > Normalize Frequency Response (use these two commands for linearizing frequency responses).
New points can be inserted by left clicking at the lines between the points.
In order to enter the modifications made in the curve window, the shape must be saved using the Save button on the Time Domain Filter (FIR) dialog box.
The resulting frequency response is then displayed in the curve window.
Phase Scrambling
The phase of the original signal will be replaced by a random phase. The resulting signal will exhibit the original (average) power spectrum, but its waveform will be a random noise signal.
|
|