Selecting appropriate spectrogram parameters
When a spectrogram is generated, several parameters (FFT-Length, Frame size, Window type and Overlap) selected from the “Analyze/Spectrogram Parameters” command can be modified in order to get the desired time / frequency resolution and bandwidth of the spectrogram.
The digital spectrogram is a matrix of amplitudes. Each amplitude of that matrix corresponds to a single pixel (picture element) of the spectrogram image. The height of such a pixel is the frequency resolution [Hz]. The width of a pixel is the temporal resolution [s] displayed in the spectrogram parameters dialog. The total height of the spectrogram matrix is equal to one half of the FFT-Length. The spectrogram bandwidth is not the same as the frequency resolution of the digital spectrogram matrix. The bandwidth is usually higher than the resolution and is influenced by the frame size and the window type.
Effect of spectrogram parameters to spectrogram bandwidth and time constant
| Parameter modification | bandwidth | time constant |
| FFT-Length increased | decreased | increased |
| Frame[%] decreased | increased | decreased |
| Sampling frequency decreased | decreased | increased |
The window type also influences the bandwidth. The smallest bandwidth is realized with the rectangular window. Because of the unacceptable leakeage effect (bad selectivity and spurious frequency components depending on the signal frequency the rectangualar and Bartlett window should not be used for standard applications. So the lowest bandwidth can be achieved with the Hamming window. The largest bandwidth gives the FlatTop window. The following list is sorted by ascending bandwidths:
(Rectangular, Bartlett), Hamming, Hann, Blackman, Gauss 3.0, Kaiser-Bessel, FlatTop
In general, narrow bandwidths should be chosen if the signal to be analyzed does not have quick frequency modulations and if there is no important information in the time domain. In contrast, wide bandwidths should be chosen if there is any remarkable frequency modulation or if there are important temporal patterns.
The examples of a Chaffinch (Fringilla coelebs) song shown here were produced with different spectrogram parameters. The following parameters are the same for all spectrograms:
- FFT-Length = 512
- Overlap = 99,21%
- Sampling frequency = 22.05 kHz
These settings will produce a temporal resolution of 0.36 ms. The y-scale is limited to 8 kHz (File/Export Parameters) because there are no signals beyond that frequency. Usually the spectrogram would show signals up to 11.025 kHz (1/2 * 22.05 kHz).
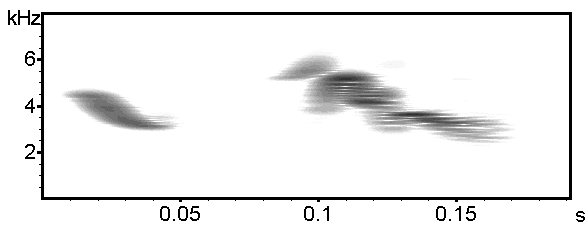
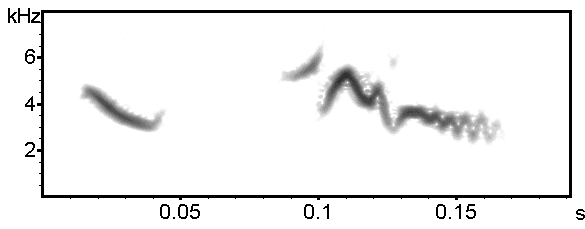
Because of the swift frequency changes and the short song elements in this song, the narrow bandwidth of 56 Hz is too small.
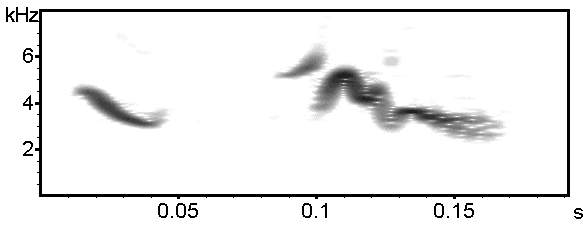
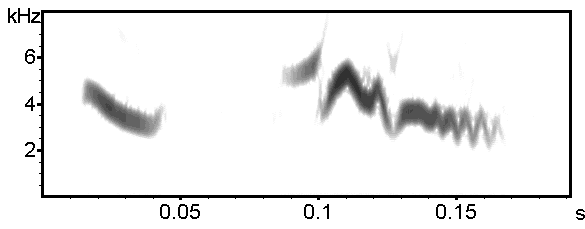
These settings are the most appropriate for this song. It is a good compromise between time constant and bandwidth, because the frequency modulation at the end of the last element can be seen clearly and the pitch measurements are still acceptable.
These settings may also be acceptable as those above.
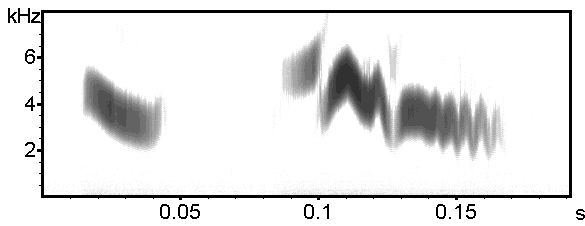
The bandwidth is too high for this kind of signal.
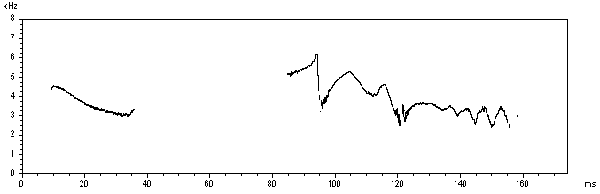
This display shows the same section analyzed with the Analyze/One-dimensional Transformation/Instantaneous frequency command. This kind of analysis does not have the tradeoff between time constant and bandwidth. Both frequency and temporal properties can be measured very precise. However, it does only work properly for signals without any harmonics (pure tone whistles). There is another analysis option (Analyze/One-dimensional Transformation/Zero-crossing analysis), which provides simliar results, except, that the precision is a little bit lower. However, the zero-crossing analysis is not limited in duration as the instantaneous frequency command. Additionally the zero-crossing analysis is much more faster.
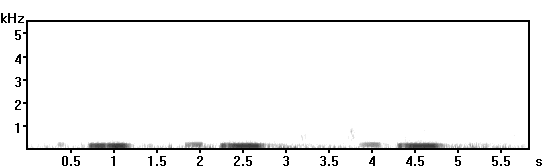
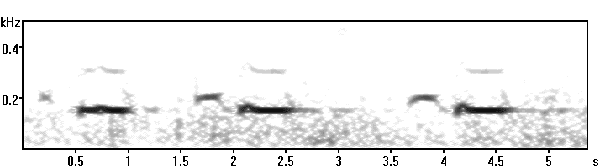
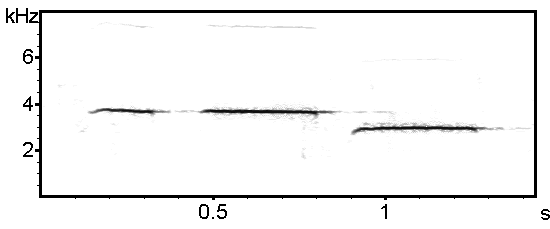
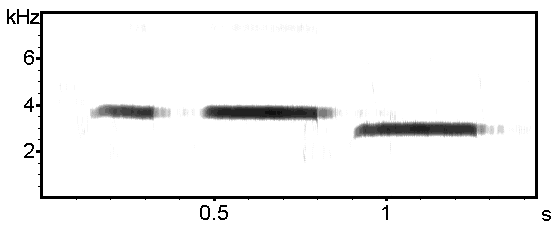
The next example is the song of a M ountain Chickadee (Parus gambeli) which does not have any frequency modulation within the clearly separated elements.
This narrow bandwidth spectrogram is appropriate to show the properties of this song, because there are no major frequency modulations and the inter-element duration is relatively long.
This wide bandwidth spectrogram is also acceptable, but the precision of pitch measurements is limited. However, if you are interested in the reverberation visible at the end of each element, these settings may be more useful to extract the temporal properties of the reverberation.
For analyzing low frequency signals it may be useful to decrease the sampling frequency of the sound card. Sampling frequency conversion can also be done subsequently by using the command Edit/Format/Sampling Frequency Conversion…