
RECORDER Manual
| |
|
|
Waveform display  : The waveform of each active channel will be displayed. : The waveform of each active channel will be displayed.
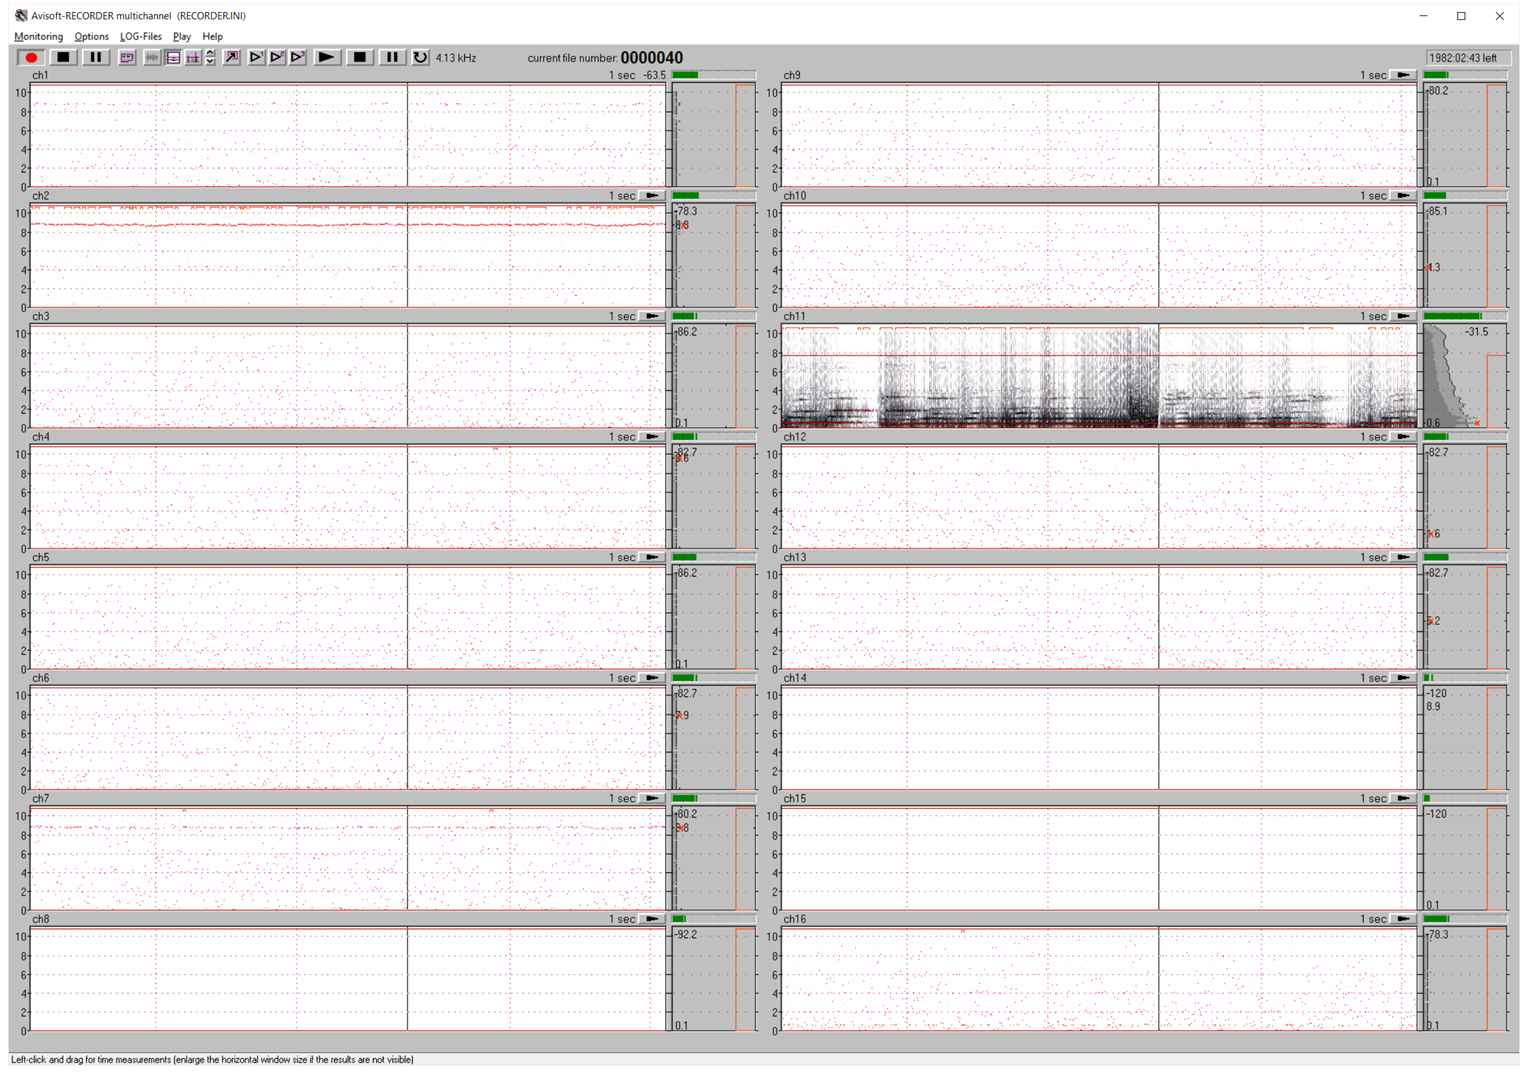
Spectrogram display  : The spectrogram of each active channel will be displayed. In this display, the trigger event frequency interval can be modified graphically by mouse. Additionally, a cross-hair cursor allows to measure frequency and time. For time measurements left-click at the start point and drag the cursor to the end point. : The spectrogram of each active channel will be displayed. In this display, the trigger event frequency interval can be modified graphically by mouse. Additionally, a cross-hair cursor allows to measure frequency and time. For time measurements left-click at the start point and drag the cursor to the end point.
Energy display  : The energy within the pre-defined trigger event frequency interval of each active channel will be displayed. The trigger event threshold can be changed graphically by mouse. : The energy within the pre-defined trigger event frequency interval of each active channel will be displayed. The trigger event threshold can be changed graphically by mouse.
Root mean square : Activates a root mean square (rms) trace on the waveform display for measuring purposes. The rms is displayed in amber color:

Maximum columns > 1 ... 8 : Defines the maximum number of display columns when a large number of channels is activated. Increase this setting when the vertical space on the RECORDER window is not sufficient for properly showing all the channels (see sample with two columns).
Grid : This option will add a grid to the above displays.
Large buttons : This option will enlarge the buttons in order to better support touchscreens.
Status display : This option will launch a status window that shows a number of general status information items (current file number, recent number of files, recent duration, free storage, errors,
). At the programmed Daily Alarm time, the current content of this window will be saved into the logfile STATUS.TXT, which can be sent as an email via the SwithMail program through the command Monitoring/Daily alarm actions
Double-right click at the status window in order to reset the recent files and error entries.
|
|