
Correlator Manual
| |
The correlation algorithm
|
|
The peak correlation coefficient displayed in the correlation matrix is defined as follows:
The two spectrograms are shifted incrementally past each other along the time axis. For every offset (shift) position the correlation coefficient is computed according to the following formula:
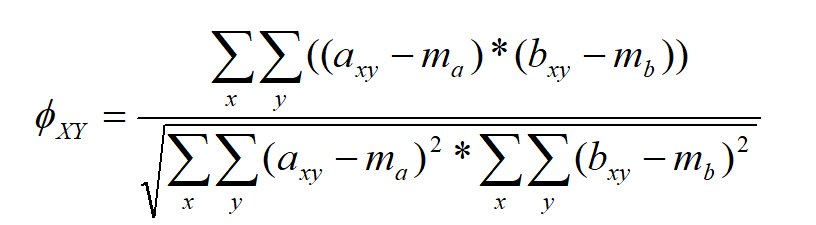
ma and mb are the mean values of the spectrograms. axy and bxy are the intensities of the spectrogram points at the locations x,y.
The correlation coefficient is a value ranging from -1 to +1. 1 means that the two spectrograms are identical. 0 means that there is no similarity between the spectrograms. Values below 0 would theoretically occur when the two spectrogram patterns were inversely related (which will not occur in practice).
The maximum value of the correlation coefficients of all shift offsets between the two spectrograms is saved in the correlation matrix.
|
|