
Lossy Audio Data Compression Effects
This page demonstrates the distortion that can be added to a soundfile when it is saved with lossy data compression. It is nearly impossible to distinguish between the original and the compressed version of the test file by listening. However, if you look at the spectrograms, you will see significant distortions (additional noise) around rapidly modulated sounds. Also, soft sounds (the constant sine signal at 17 kHz) will be degraded. Additional background noise seems to have no major effects on the spectrographic representation because the potential spurious noise is buried in that original masking noise. It should also be noted that the occurrence of the spurious noise is very unpredictable (the original zig-zag shaped signal ranging from 1.13 to 1.56 sec is identical to that from 3.1 to 3.54 sec). In the first example, the MP3 system was used. There are differences between the various versions (including the ATRAC system employed in MiniDisk recorders). However, the principle is always the same. If the available bit rate is not sufficient for encoding a given signal, the data reduction algorithm has to remove those parts of the sound, that are inaudible or less important for the human perception. This is done by reducing the bit-depths in some frequency bands. That procedure may produce additional spurious (quantization) noise in the decoded signal. Even more sophisticated algorithms as the bit reservoir feature of MP3 will lead to loss of information or distortion, as soon as complicated sounds last for more than a few milliseconds
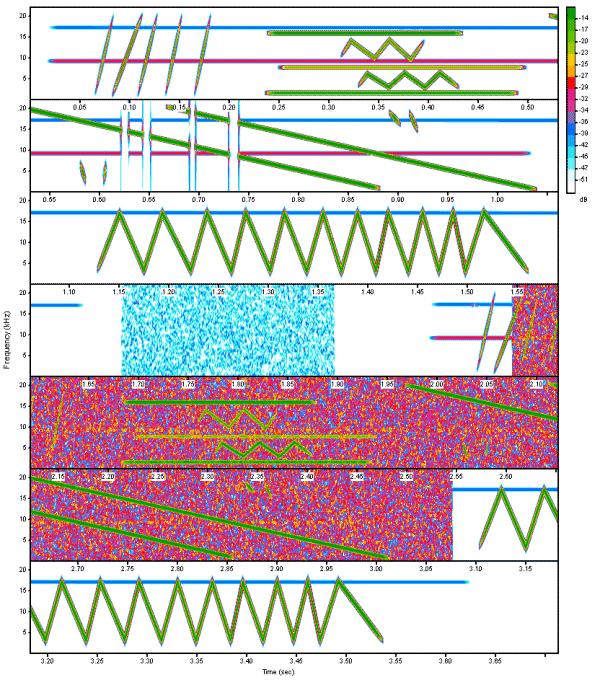
This is the spectrogram of the original sound file. Listen to the original soundfile.
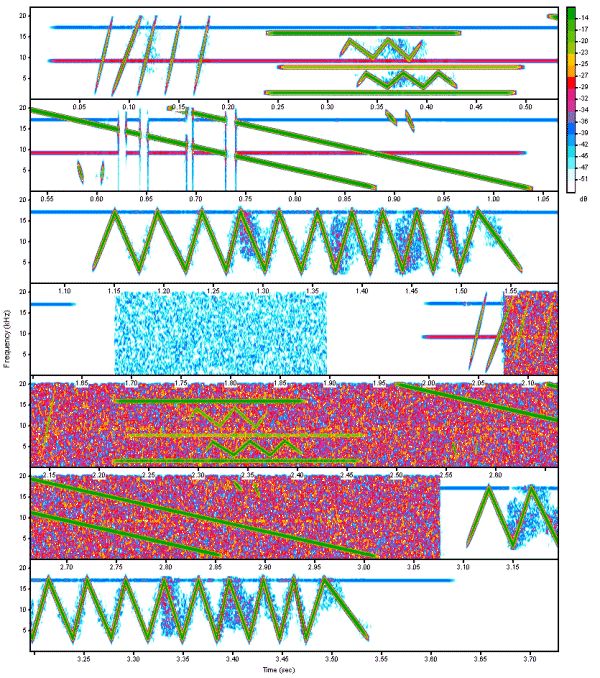
This is the spectrogram of the compressed MP3 sound file. Listen to the compressed soundfile (decoded back into .wav file format) and the compressed .mp3 soundfile.

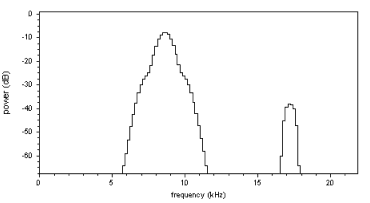
This is a single spectrum taken from the spectrogram at t=3.34 sec (uncompressed file)
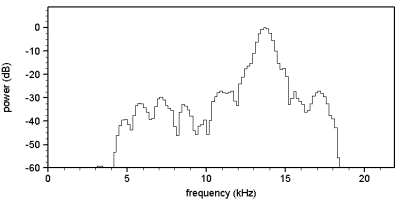
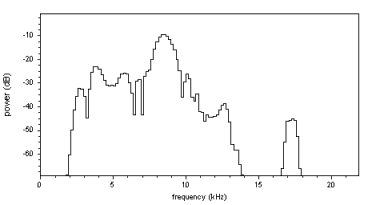
This is a single spectrum taken from the spectrogram at t=3.34 sec (compressed MP3 file). The spurious signal components ranging from 5 to 12 kHz have a maximum amplitude of -28 dB (relative to the peak amplitude of the original signal). Theoretically, a bit-depth of about only 4 bit (28dB/6dB) would be sufficient to represent that worst case situation.
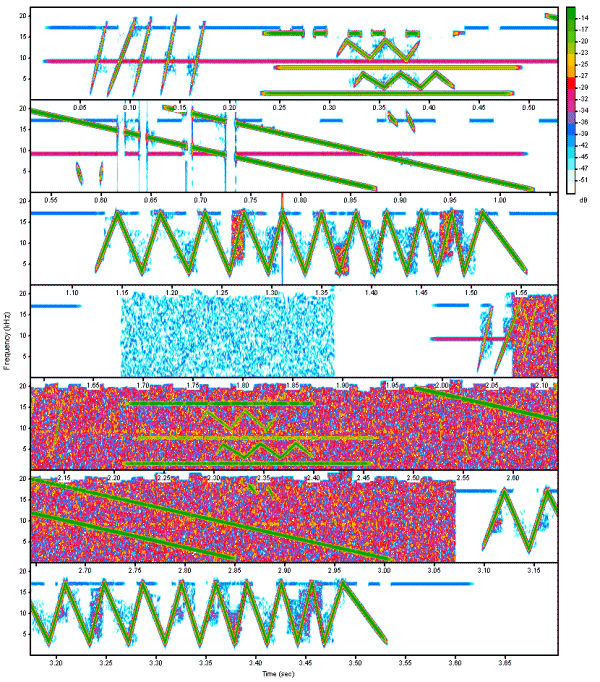
This is the spectrogram of the test signal after passing through a MiniDisk recorder employing ATRAC 4.5. Listen to the compressed soundfile (decoded back into .wav file format). It reveals more dramatic artifacts than the MP3 example. The constant sine signals at 16 and 17 kHz temporarily disappear completely. The spurious noise surrounding the rapid frequency-modulated sound structures is considerably stronger at some locations.
This is a single spectrum taken from the orginal test signal (uncompressed file)
This is a single spectrum taken from the test file at the same location, but after passing through MiniDisk (worst-case situation at t=1.374 sec).