Measuring sound parameters from the spectrogram automatically
If the sound files to be analyzed are reasonably structured, the Automatic Parameter Measurements tool can dramatically speed-up the acquisition of sound parameters. A wide range of various measurements can be carried out:
Figure 1: The Automatic Parameter Measurements setup dialog.
The success of the automatic measurements will heavily depend on the type of sounds, the quality of sound recordings and the configuration settings made under Tools > Automatic parameter measurements > Automatic parameter measurements setup…. The first and most essential step in configuring this tool is to establish a safe element separation. There are six options in the ‘Element separation’ section:
- automatic (single threshold)
Use this option for sound files, where all elements nearly have the same amplitude. - automatic (two thresholds)
This option is suited for sound files containing elements with varying amplitudes. - automatic (three thresholds)
Use this option for sound files containing elements with varying amplitudes that require separate thresholds for detecting the start an end of each element - interactively (section labels)
This option is appropriate for sounds where the automatic element separation is not possible. - automatic (whistle tracking)
This option is suited for detecting soft whistles in noisy sound recordings.
automatic (single threshold)
The single threshold is used for both detecting the elements and the determination of the start and end point of each element:
Figure 2a: Single threshold element separation (option “relative to maximum” not activated).
Figure 2b: Single threshold element separation (option “relative to maximum” activated).
The point where the amplitude exceeds the threshold is assumed to be the start of an element. Similarly, the point, where the amplitude goes first below the threshold is the end point of the element.
The thresholds can be adjusted interactively. There is an option called “show threshold” that activates a graphic display, which might help to optimize the settings. The primary element separation threshold can easily be edited graphically (by dragging):
An additional hold time parameter prevents to recognize the end of an element in case the amplitude goes below the threshold for a short period of time only. For adjusting the threshold, it might be useful to first set the ‘Hold time’ parameter to a small value. Then, if all elements are recognized properly, increase the hold time parameter in order to melt closely spaced related parts.
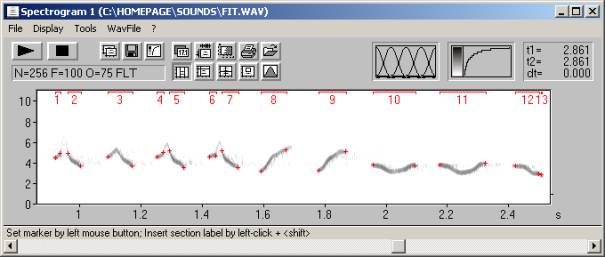
Figure 3: The ‘Hold time’ parameter of 5 ms is too low for these amplitude modulated elements. The first, third and fourth element are each recognized as two separate elements.
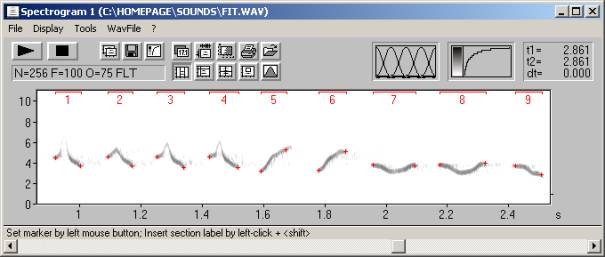
Figure 3: Increasing the ‘Hold time’ parameter to 50 ms provides satisfying results.
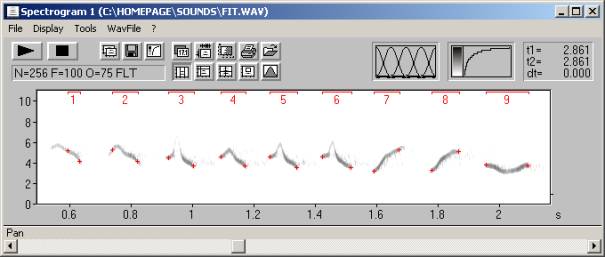
Figure 4: Larger amplitude differences lead to poor start and end point locations. In such cases use the ‘two thresholds’ option described below.
automatic (two thresholds)
The first threshold is used for element detection only. The second start/end threshold is used to determine start and end points. The specified relative start/end threshold is used to calculate an internal individual absolute threshold for each detected element:
Figure 5: Two thresholds element separation: The first absolute threshold for the element detection is shown as a continuous horizontal line. The short lines depict the second relative start/end threshold that is referenced to the maximum of each detected element. In this way, the automatically recognized element borders are independent from the absolute element amplitudes. This is especially important for vocalizations with high dynamic ranges (both loud and soft elements) or in recording situations with varying distances between the animal and microphone (e.g. flying bats). Adjusting the two parameters should be done in the following sequence: First use the ‘automatic (single threshold)’ mode to adjust the first absolute threshold for element detection. Modify this value until all elements are recognized safely. At this stage it does not matter, whether the element borders are recognized correctly. It is only important that there is a number displayed above each element:
Figure 6: Adjusting the absolute element detection threshold. Then switch back to the ’automatic (two threshold)’ mode to adjust the second relative ‘start/end threshold’. Start with high values (e. g. –5dB) and decrease the relative threshold (down to – 10 … – 20 dB), depending on the structure of your signals. Alternatively, adjusting the two thresholds can be done without switching into the single threshold mode. Then first set the ‘start/end threshold’ to 0 dB to find the correct absolute element detection threshold.

Figure 7: The relative start/end threshold of –17dB is too low. The reverberation noise between the elements prevents proper element separation at this low threshold.
Figure 8: Correctly recognized elements (using a start/end threshold of –11 dB), despite of the varying element amplitudes.
automatic (three thresholds)
This option is similar to the above two thresholds option, except that there are two separate thresholds for the localization of the start and the end of each element. This is certainly useful for sounds influenced by reverberration.
If there is too much noise that prevents the automatic recognition, you might try to remove that noise. If the noise does not overlap with the sounds of interest, then a simple high- or low-pass filter might help. It is possible to hide low frequencies on the spectrogram window from the command Display/’lower Cut-Off Frequency…’.
In case the noise overlaps with the sound elements, then it would be possible to remove that noise manually by using the command Tools/Cursors/’Standard eraser cursor’:
Figure 9: Noise prevents the proper element detection
Figure 10: Manually erasing the noise provides the desired result
Another option for rejecting broad-band noise is the Entropy option in the ‘Post filter’ section.
In case the automatic element detection does not work satisfying for all elements, it is possible to edit the automatically detected element borders subsequently by clicking at the “edit>” button. The automatically detected element borders will be converted into section labels and the element separation method is set to ‘interactively (section labels)’:
interactively (section labels)
In some recordings the automatic threshold-based element separation may not work satisfying because of strong ambient noise or because of poorly structured vocalizations. For such sounds, the element borders can be defined manually by inserting section labels. These section labels can be quickly inserted by left-clicking at the desired start point while the shift key is pressed. Then drag the end point of the label to the desired location and release the mouse button. The location of these labels can be altered subsequently by simple dragging. Section labels can be placed at various layers (layer 1…3 and total). However, for this application, the specific layer is not important.
Figure 11: Section labels have been placed on the top of the spectrogram.
automatic (whistle tracking)
This element separation method employs an alternative detection algorithm that does not rely on amplitude thresholds. Therefore, this option is more appropriate for detecting soft whistle-like sounds in noisy sound recordings (certainly for analyzing USV’s by laboratory mice and rats). The implemented algorithm searches for steady signals having a relatively stable (peak) frequency course without rapid frequency modulations.
Figure 12: Principle of the whistle tracking algorithm
Figure 13
The “max change” parameter is the tolerated maximum change of the peak frequency between two consecutive time bins on the spectrogram, expressed as the number of pixels on the spectrogram (frequency bins). This parameter should be set to a value between 1 and 4 pixels (depending on the time and frequency resolution of the spectrogram). For best results, this parameter should be set to the smallest possible value that still recognizes all the elements to be detected. Conversely, the “min duration” parameter should be set to the largest possible value that still recognizes all the elements to be detected.
The “whistles” button in the “Presets” section on the “Automatic Parameter measurements setup” dialog box provides appropriate settings to start with.
For proper function of the algorithm, the background noise should have a broad-band structure. There should be only the thermal noise of the microphone or noise caused by the movement of the animals on the substrate. Any additional regular harmonic noise (e.g. electromagnetic interferences from technical equipment) may prevent the reliable detection.
automatic (spectral entropy)
This element separation method employs the Wiener Entropy that can be used to detect tonal vocalizations in noisy recordings. The Wiener Entropy (spectral flatness) is calculated by dividing the geometric mean of the spectrum by the arithmetic mean of the spectrum and ranges theoretically from 0 (pure tone signal) to 1 (white noise). An element is detected each time when the entropy falls below the defined max entropy threshold. In order to exclude unwanted short noise signals the min duration threshold on the Post filter on elements section can be used (set the max entropy threshold to 1). Use the show trace option to visualize the trace of the entropy.
automatic (spectral bandwidth)
This element separation method employs a spectral bandwidth parameter that can be used to detect tonal vocalizations in noisy recordings. The spectral bandwidth parameter is calculated by counting the most intense number of frequency bins of the spectrum that represent a user-defined fraction of the total energy of the spectrum. An element is detected each time when the spectral bandwidth falls below the defined maximum number of frequency bins threshold. Note that the frequency bins threshold will be affected by the analysis bandwidth of the FFT that is determined by the FFT size and the windows type. In order to exclude unwanted short noise signals the min duration threshold on the Post filter on elements section can be used (set the max entropy threshold to 1). Use the show trace option to visualize the trace of the spectral bandwidth.
In some cases it might happen that the autmatic detection process does not work successfully for all elemenst. In this case it is possible to manually edit the results by clicking at the edit> button next to the elemenmtseparation method list box, which creates section labels from the automatically detected elements and switches to the interactive element separation mode. In this way it is possible to edit the automatically detected elements, making it possible to label undetected elements by pressing the Shift key and left-clicking at the desired start point in the upper third of the spectrogram and dragging the mouse cursor to the end point. The section labels can be resized and shifted by the mouse cursor or deleted by right-clicking at them.
Once the element separation described above is working satisfying, the desired parameters to be measured can be activated from the setup dialog (see also the manual for the details):
Temporal Parameters
Spectrum-based Parameters
The above spectrum-based parameters can be taken at various locations within each element (or syllable):
The example below illustrates the differences between the options Mean and Max spectrum of entire element. Assuming a syllable consisting of a constant frequency and a frequency-modulated part having a constant amplitude throughout its duration, the mean spectrum would be dominated by the constant frequency part (most of the energy is concentrated at the constant frequency). Instead, the max spectrum would have a flat top across the entire frequency range of the syllable, regardless of the duration of the constant frequency section. This means that the ‘Max spectrum of entire element’ can be used to describe the frequency range of a vocalization. However, in frequency-modulated and whistle-like vocalizations, the two options ‘Min’ and ‘Max param. of entire element’ in conjunction with the ‘Peak frequency’ would provide more precise results.
Mean/Max spectrum of entire element
Min/Max/Mean parameter of entire element (applied to the peak frequency)
Alternative measurement approaches
Another way for measuring frequency contours automatically is the spectrogram window command ‘Tools’/’Scan frequency contour and amplitude envelope’.
The resulting frequency values can be obtained by executing the File/Save command of the Graphic Synthesizer. The ASCII file NEW.ft (or xxxxxxx.ft) contains the frequency values along with the associated time stamps.