Measuring sound parameters from the spectrogram manually
There are several ways to measure sound parameters from the spectrogram:
Cursors
There are different cursor modes which may be activated from Tools/Cursors/…
 The ‘Standard marker cursor’ allows to measure duration’s by left-clicking and dragging. The associated values are displayed at the right top corner of the spectrogram window. The current duration value can be exported as an ASCII string by File/Data export/Copy measured value or Copy t1, t1. Alternatively simply click at the top right cursor value frame. The ASCII string is copied into the clipboard and can be pasted from other applications.
 Additionally, the single values can be automatically transferred into an Excel spread sheet. This can be configured from File/Data export/’DDE- Parameters / Log file…’
 In the ‘Standard marker cursor’ mode an additional frequency cursor can be activated by clicking at the area between left windows margin and frequency axis and dragging it to the right (or by Tools/Cursors/’Insert bound frequency cursor’). This cursor moves along the peak frequency.
Another cursor available in the ‘Standard marker cursor’ is the frequency cursor which can be activated from Tools/Cursors/’Insert frequency cursor’ or by clicking at the area above the spectrogram display and dragging the cursor down into the spectrogram. This cursor can be moved freely for precise frequency measurements.
 A similar cursor for measuring harmonic frequency structures is available form Tools/Cursors/’Insert harmonic frequency cursor’ or by >pressing the shift key and clicking at the area above the spectrogram display and dragging the cursor down into the spectrogram.
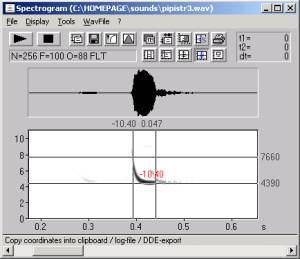
 The ‘Free reticule cursor’ is a thread cross cursor replacing the mouse cursor. In this mode time, frequency and amplitude can be measured. Left-clicking will export the current values. The ‘Bound reticule cursor’ is the same, except that the frequency thread moves along the peak frequency (the current vertical mouse cursor position is ignored).
 The ‘Free reticule cursor’ is a thread cross cursor replacing the mouse cursor. In this mode time, frequency and amplitude can be measured. Left-clicking will export the current values. The ‘Bound reticule cursor’ is the same, except that the frequency thread moves along the peak frequency (the current vertical mouse cursor position is ignored).
Labels
 Labels can be placed anywhere on the spectrogram. A short label text can be annotated to either a single point at a certain time/frequency location or to a time section (section label). Single point labels are annotated from Tools/Labels/’Insert labels’. Alternatively, this can be made by right –clicking and selecting the associated popup menu item.
 The coordinates of these labels can then be exported from Tools/Labels/’Label settings…’ by the button ‘Copy’. This will copy the selected labels as an ASCII table into the clipboard, which can subsequently be pasted into an Excel spread sheet for instance.
 Section labels can be used to create a specific grid for logging data at regular intervals with the ‘Free reticule cursor’. The cursor then snaps automatically into the temporal grid. This grid option can be activated from Tools/Labels/’Section labels grid…’ This may be especially useful for signals where automatic methods are not possible.
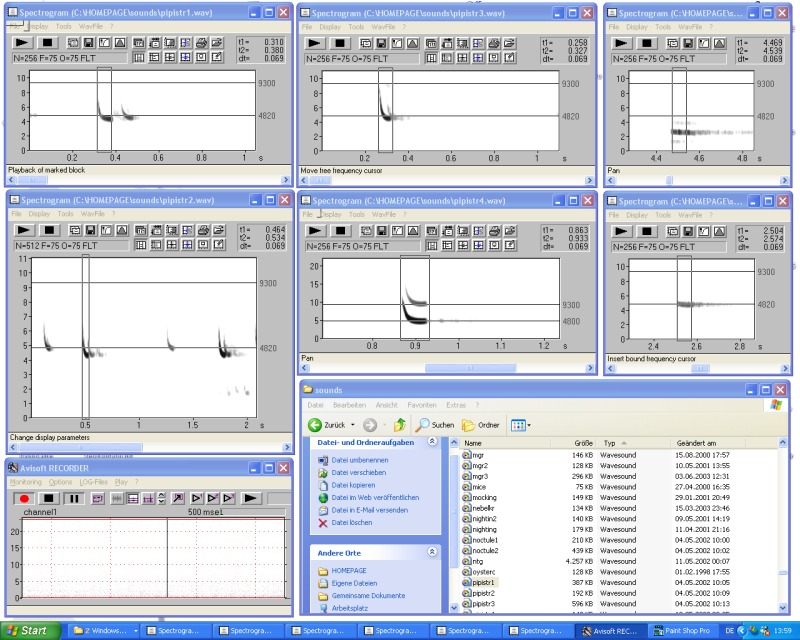
In order to enable comparisons between different sound files, the measurement cursors of several program instances can be linked together. For this purpose, several instances of the SASLab Pro software can be operated at the same time (e.g. by the command File/New Instance). The dialog Tools/Cursors/”Cursor linkage between Instances…” allows to activate this cursor linkage option. When the desired dialog items are selected and several instances of SASLab Pro are running, the corresponding cursors will move simultaneously in all instances, where the linkage option has been activated. (see an example screen shot)