
SASLab Manual
| |
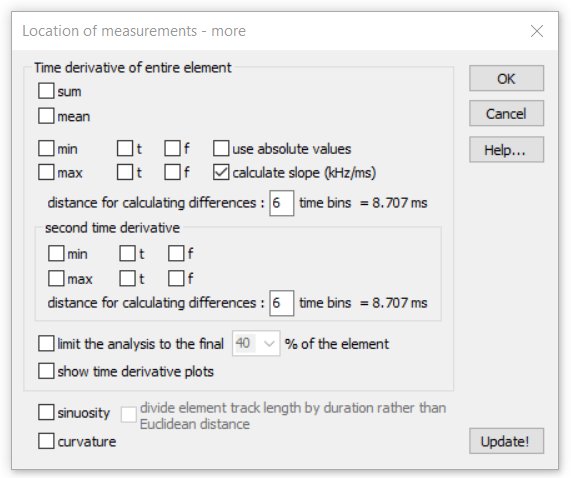
Spectrogram window : Tools > Automatic parameter measurements > Automatic parameter measurements setup > Location of measurements - more
|
|
Time derivative of entire element This section provides parameters that are based on the time derivative of the spectrum-based parameters.
Currently, only the Peak frequency and the Fundamental freq. are supported.
sum The sum (integral) of the time derivative over the entire element is calculated (corresponds to the frequency change from the start to the end).
mean The mean of the time derivative over the entire element is calculated. If the option calculate slope (kHz/ms) is checked, this measure represents the average frequency slope of the element expressed in kHz/ms.
min The minimum of the time derivative over the entire element is calculated. If the option use absolute values is checked, the minimum absolute value is determined.
Otherwise, the largest negative (descending) change will be provided. If the option calculate slope (kHz/ms) is checked, the change is expressed in kHz/ms (kHz referenced to a time interval of 1.0 ms).
The option t provides the time offset where the minimum was detected (expressed in seconds relative to the start of the element) and the option f provides similarly the corresponding frequency at that point in time.
max The maximum of the time derivative over the entire element is calculated. If the option use absolute values is activated, the maximum absolute value is determined.
Otherwise, the largest positive (ascending) change will be provided. If the option calculate slope (kHz/ms) is activated, the change is expressed in kHz/ms (referenced to a time interval of 1.0 ms).
The option t provides the time offset where the maximum was detected (expressed in seconds relative to the start of the element) and the option f provides similarly the corresponding frequency at that point in time.
use absolute values If activated, the sum, mean, min and max will be calculated from the absolute values of the time derivative.
calculate slope (kHz/ms) : If activated, the mean, min and max are expressed in kHz/ms (referenced to a time period of 1.0 ms). The peak frequency change between the spectrogram time bins is divided by the time interval between those two bins.
distance for calculating differences : xxx time bins This setting determines the temporal distance between the spectrogram bins from which the frequency change is calculated.
Due to the limited frequency resolution of the spectrogram, it is sometimes (depending on the FFT length and overlap settings) required to increase this distance in order to get more accurate results for signals that exhibit a slow frequency change.
Note that a large distance value will prevent to calculate the time derivative at the margins of the element. If one is interested in the amount of frequency change in rapid frequency jumps, the distance should be set sufficiently high and
the option calculate slope (kHz/ms) must be deactivated in order to measure the frequency difference properly.
second time derivative This section allows to analyze the second time derivative in order to find reversal points within the frequency contour. The mechanism is similar to the first time derivative described above.
limit the analysis to the final xx % of the element If activated, the time derivative analysis will be limited to the selected final percentage of each element.
In conjunction with the max and f options and the 40% setting, it is possible to measure the characteristic frequency (frequency of the call at its lowest slope toward the end of the call),
which is commonly used for identifying bat species.
show time derivative plots This option displays the time derivative function on the spectrogram from which the above parameters are calculated.
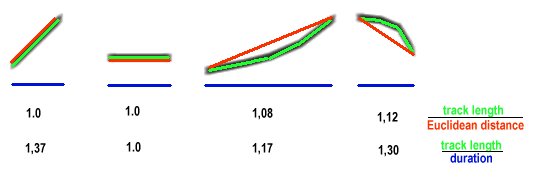
sinuosity This option calculates the ratio of the element track length and the Euclidean distance between start and end point of the element on the spectrogram image.
In case the option divide element track length by duration rather than Euclidean distance is activated, the ratio of the element track length and the duration of the element ic calculated. This parameter can be used to quantify frequency modulation.
curvature
This option calculates the average curvature of the elements expressed in Hz. It is determined by averaging the differences of the interpolated call frequencies (from start to end frequency) and the actual instantaneous frequencies at each time bin of the spectrogram.
This parameter can be used to quantify the deflection of bat echolocation calls.
In case the elements contain soft intervals or silent breaks, the sinuosity and curvature measurements can be distorted by the background noise (interpreting the background noise as a signal and thereefore providing wrong results). This can be avoided by activating the
Reject if peak ampl. < xx dB option on the main Automatic parameter measurements setup dialog box and adjusting the dB threshold in such a way that the noise is rejected but the vocalizations are still detected.
|
|