
SASLab Manual
| |
Spectrogram window : Tools > Automatic parameter measurements > Automatic parameter measurements setup > Automatic Parameter Measurements Statistics
|
|
This dialog box allows setting up various descriptive statistics parameters on the activated measurements of the Automatic Parameter Measurements tool.
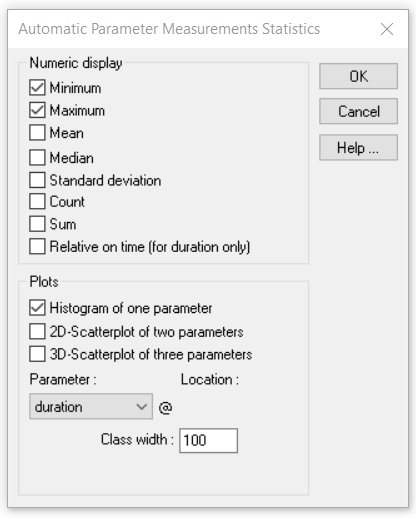
Numeric display
Select here the desired statistics parameters. The selected parameters will appear on the top of the Automatic Parameter Measurements display window.
The following parameters are available:
Minimum, Maximum, Mean, Median, Standard deviation, Count, Sum, Relative on time (for duration only)
The relative on time (duty cycle) corresponds to the sum of the element durations divided by the total duration of the spectrogram (the option Compute parameters from entire spectrogram must be activated).
Plots
This section activates an optional histogram or scatterplots.
Histogram of one parameter A histogram of one measurement parameter is created.
2D-Scatterplot of two parameters A two-dimensional scatterplot of two measurement parameters is created.
3D-Scatterplot of three parameters A three-dimensional scatterplot of three measurement parameters is created, which allows exploring dependencies between parameters. The viewing angle can be modified manually by left clicking and dragging the mouse cursor.
Parameter Select here the measurement parameter for the plot.
Location Select here the location (within the element) at which the selected measurement parameter should be taken.
Class Width Defines the x-axis resolution of the histogram. The unit of the class width is 1 s for all temporal parameters and 1 Hz for all frequency parameters.
|
|