SASLab Manual
| |
Curve window: Display > Display range...
|
|
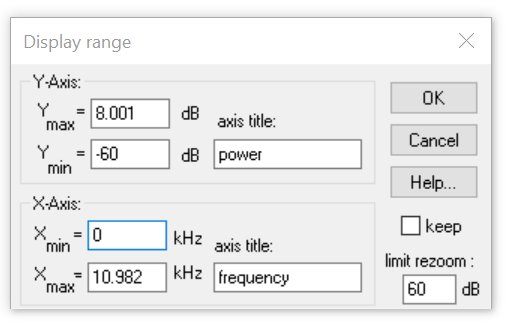
This dialog box allows to manually adjust the visible display range of the data.

Ymax=: Defines the upper Y axis limit of the graph.
Ymin=: Defines the lower Y axis limit of the graph.
Xmin=: Defines the lower (left) X axis limit of the graph.
Xmax=: Defines the upper (right) X axis limit of the graph.
The axis title edit fields allow to edit the axis titles, which will be displayed on exported graphs, when the Show axis titles option of the Curve Window Export Parameters dialog box is activated.
For 3D graphs there are additional fields for the Z axis and two fields for defining the horizontal and vertical viewpoint direction.
The option keep will preserve the current display range for the following signals. If this option is not activated, the display range of a following One-dimensional transformation command will be reset to the default values.
The limit unzoom dB value will limit the display range of logarithmic data to the specified value when the re-zoom command is executed. This prevents rezooming to very small (e.g. -100 dB) ranges, even if there are such small values on the data set.
The Displaay range dialog box can also be activated also by double-clicking at the curve display.
|
|