
SASLab Manual
| |
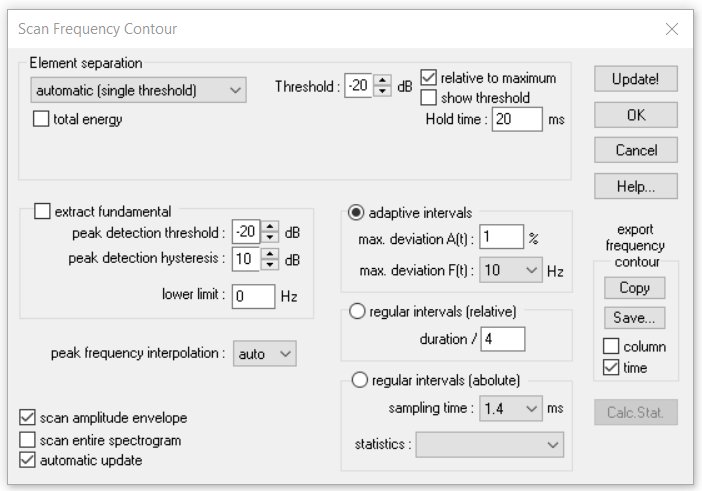
Spectrogram window : Tools > Scan frequency contour and amplitude envelope
|
|
This tool allows scanning the frequency and amplitude envelope contour of whistle-like vocalizations from the marked section of the spectrogram. The resulting contour will be displayed in the Graphic Synthesizer window.
This command can either be used for measurement purposes or for re-synthesis.
Element separation
The individual elements (syllables) of the vocalizations can be identified in a number of different ways (either by threshold comparisons or interactively through section labels). The separation mechanism is identical to that of the Automatic Parameter Measurements command. See Element separation for details.
There are three options for the temporal properties of the frequency contour:
Adaptive intervals
If this option is selected, the minimum possible number of sample points is used to satisfy the max deviation parameters listed below.
max. deviation A(t) This value determines the accuracy of the amplitude trace. It is expressed in percent of the maximum magnitude of the entire spectrogram. Larger values will produce fewer samples in the amplitude plot, which may simplify subsequent editing procedures. In order to get maximum fidelity it is recommended to set this value to zero.
max. deviation F(t) This list box determines the accuracy of the fundamental frequency trace. The topmost value, which is equal to the frequency resolution of the spectrogram, will realize the maximum possible accuracy. Larger values will produce fewer samples in the fundamental frequency plot, which may simplify subsequent editing procedures. In order to get maximum fidelity it is recommended to use the topmost value if no editing is required.
regular intervals (relative)
The detected elements will be divided into a fixed number of intervals. This means that the absolute time intervals will vary depending on the duration of each element. This option might be for instance useful for comparing the frequency contours of signature whistles. The fixed number of frequency samples would enable a more straightforward statistical analysis (e.g. cross-correlation).
regular intervals (absolute)
The sample points will be taken at fixed time intervals.
sampling time This edit field specifies the absolute distance (interval) between consecutive sample points in milliseconds. The minimum interval is limited by the temporal resolution of the spectrogram.
statistics The peak frequency samples taken from the spectrogram can be fed (by clicking at the Calc. Stat. button) into an statistical analysis module that provides the following options:
Histogram: The relative distribution of the peak frequency samples will be displayed in a separate curve window.
Frequency change The frequency changes within the detected elements will be displayed in a two-dimensional scatterplot. The x-axis represents the peak frequency at t. The y-axis represents the associated peak frequency at the next time slot (t + delta t). Delta t corresponds to the selected sampling time.
Calc. Stat. This button will calculate and display the selected statistics.
extract fundamental
If this option is activated, the fundamental frequency course is extracted from the spectrogram even if the fundamental component has not the maximum amplitude. The underlying algorithm is based on a harmonic peak search on the instantaneous spectra of the spectrogram.
The peak detection threshold parameter determines the peaks that will be included into the analysis. Low values (e.g. -20dB) will include low amplitude peaks, which may not always desired because some of these low peaks are perhaps no harmonics.
The peak detection hysteresis parameter influences the separation of neighbored peaks. The valleys between neighbored peaks must exceed the specified hysteresis parameter (e.g 10dB) if these two peaks should be interpreted as separate harmonics. Due to noise on the spectrogram, it may also be necessary to correct the automatically detected fundamental frequency manually.
Under some circumstances it might happen that the fundamental frequency detection algorithm is disturbed by noise, which can then lead to an underestimated fundamental frequency. This effect can be reduced by specifying a lower limit for the fundamental frequency (usually one knows the lowest expected frequency).
peak frequency interpolation : The peak frequency detection on the spectrogram is based on a maximum search on the instantaneous spectra. In order to increase the accuracy of the peak frequencies beyond the spectrogram resolution, an interpolation algorithm can be used. This parameter determines the number of points used for the interpolation. The option none will inhibit the interpolation, which means that the peak frequency resolution is equal to the spectrogram resolution. The option auto will select the optimal number of interpolation points for a given bandwidth.
scan amplitude envelope
This option will also scan the amplitude envelope. In order to get accurate amplitude measurements, it is strongly recommended to use the FlatTop window setting on the Spectrogram Parameters dialog box!
scan entire spectrogram
If this option is activated, the entire spectrogram (not only the visible or marked section) will be scanned.
automatic update
If this option is activated, the frequency contour scan will be updated each time the user has modified an element separation threshold via one of the spin buttons or the spectrogram selection has been modified. Activate this option to accelerate the process of finding the optimal settings.
export frequency contour
This section allows exporting the scanned frequency contour as an ASCII table to other applications. The sound elements are separated by carriage return / line feed (new line) control characters. In case the frequency contour has not been detected properly, it is possible to subsequently edit the contour manually within the Graphic Synthesizer window before finally exporting the data.
Copy
Copies the contour into the clipboard.
Save
Saves the contour into a .TXT file.
column
If this option is activated, the samples will be arranged in a single column (each sample in a new row). Otherwise, the samples of an element will be arranged in a single row.
time
This option adds the time stamp to each frequency sample.
The frequency contour and amplitude envelope can alternatively be taken from the *.ft (frequency) and *.at (amplitude) ASCII files that are created each time the current arrangement is saved (command File > Save).
Update!
This button will re-calculate the frequency contour with the current settings. The frequency contour will be displayed both on the spectrogram in the spectrogram window and on the separate Graphic Synthesizer window.
OK
The OK button will display the frequency contour in a separate Graphic Synthesizer window and close the Scan Frequency Contour dialog box. Use the Update! rather than the OK button for optimizing the settings (the results will then be displayed visually in the spectrogram window).
|
|