Recording and analyzing rat or mouse ultrasonic vocalizations for behavioural, neurophysiological and pharmacological studies (USV detector)
Getting started
1. Installing the Avisoft-RECORDER USGH and SASLab Pro software from the Avisoft Downloads page. At this time, the USB Hardlock dongle should still not be connected to the computer. If you have purchased the UltraSoundGate hardware, install the RECORDER USGH software using the installation program in the default subfolder “RECORDER USGH” (not “RECORDER”).
2. Connecting the Avisoft-UltraSoundGate unit to an unused USB port of the computer. Windows should automatically detect the UltraSoundGate device and install its device driver. Once the device installation has completed and the amber LED labeled “REC” on the UltraSoundGate device starts to flash, the RECORDER USGH software can be launched (Start > Programs > Avisoft Bioacoustics > RECORDER USGH).
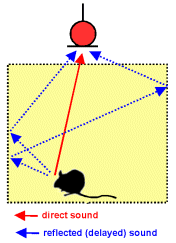
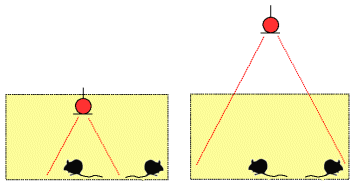
3. Arranging the ultrasound microphone close to the cage and connecting it to the UltraSoundGate device via the supplied extension cable. Note that larger acoustically reflective surfaces (such as the walls of a plexiglas cage) surrounding the microphone and/or the animals may introduce unwanted reverberation. Also, keep in mind that the receiving angle of the microphone is relatively small at higher frequencies. Therefore, the distance between the cage base and the microphone should be adopted to the dimension of the cage base.
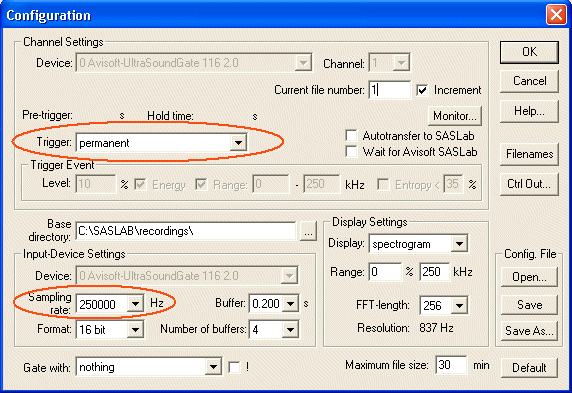
4. Setting up the Avisoft-RECORDER USGH software from the command “Options”/”Configuration…” Select the desired sample rate and trigger mode. The sample rate must be higher than twice the maximum frequency of the USVs that should be analyzed. So, for a maximum signal frequency of 120 kHz, a sample rate of 250 kHz would be appropriate. For continuous recording sessions over longer periods of time (e.g. 10 minutes), the “Trigger” options “permanent (unlimited)” or “permanent (limited)” should be selected. In case there are only sporadic vocalizations that need to be monitored over several hours or days, the trigger option “level of this channel” should be used. See the tutorial on Avisoft-RECORDER for details.
5. Adjusting the recording level either from the level meter on the UltraSoundGate device or from the level displays in the RECORDER software. To do this from the RECORDER software, first click at the Pause button and then at the red Record button and adjust the red gain control knob on the UltraSoundGate unit until the level meter indicates an appropriate recording level. Any overmodulation (indicated by red color on both the level meter and the real time spectrogram display) should be avoided.
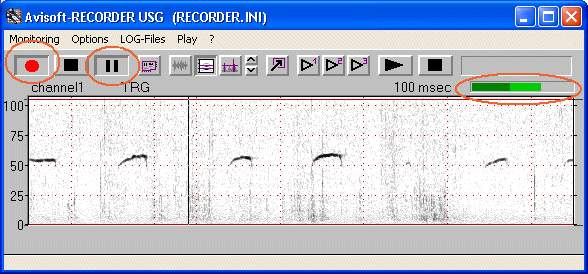
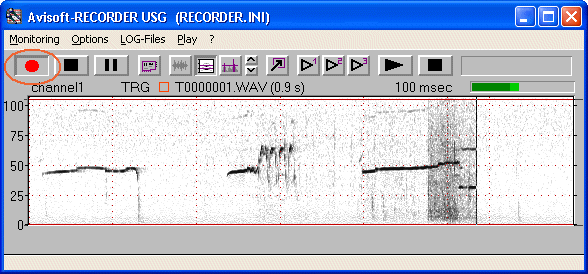
6. Starting a recording session by clicking at the red start button (the pause button is not activated). The incoming sounds are now being recorded into the displayed .wav file (T00000001.WAV), which is located in the base directory that has been specified in the Configuration dialog box (by default C:\Users\<username>\Documents\Avisoft Bioacoustics\RECORDER_USGH).
The currently running recording session can be finished by clicking at the Stop button (or by executing the command Monitoring/Stop). Click at the Start button again for initiating a new recording session (the file name will be incremented automatically).
7. Viewing the recorded .wav files with Avisoft-SASLab Pro. The recorded sound files can be opened in SASLab Pro from the command File/Open… or alternatively by drag&drop.
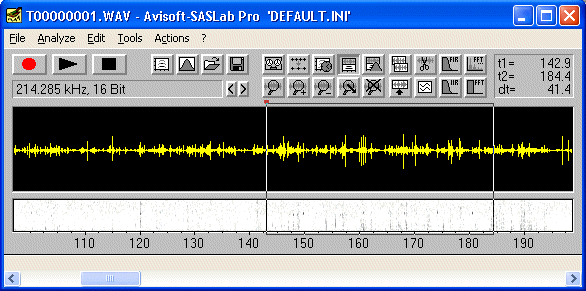
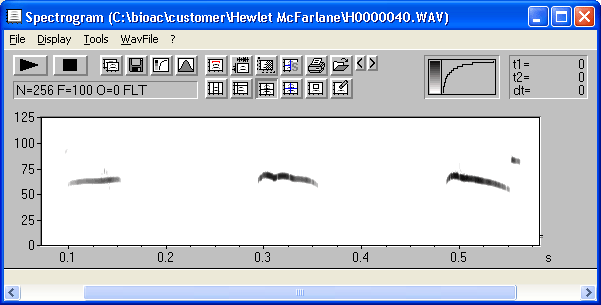
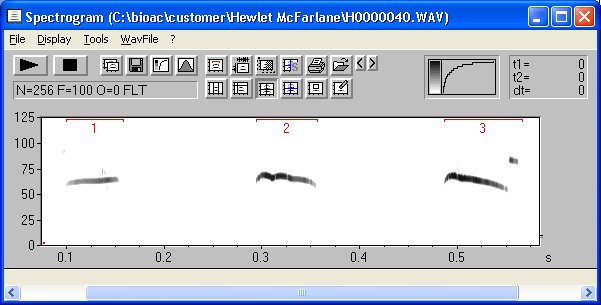
To see a detailed spectrogram display of a portion of the entire sound file, mark the desired subsection and create a spectrogram by executing the command “Analyze”/”Create Spectrogram”
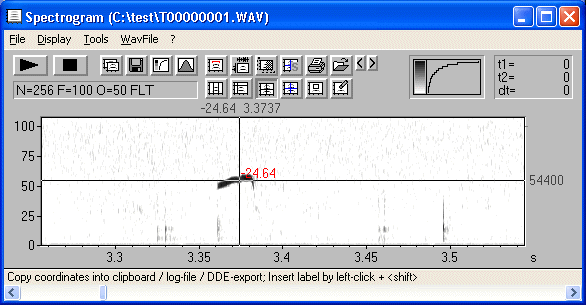
Various measurement cursors can be used to read out both time and frequency parameters.
Advanced sound analysis
Avisoft SASLab Pro provides powerful analysis tools that can significantly speed up the sound analysis.
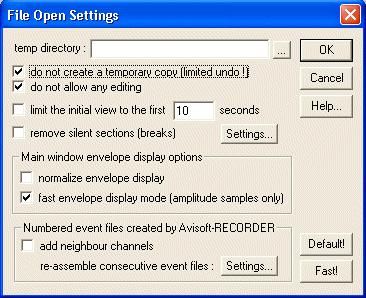
If the files to be analyzed are very large (several minutes long), it might be useful to activate the following options on the “File”/”File Open Settings…” dialog box that will accelerate the file open command.
See the tutorial on Measuring sound parameters from the spectrogram automatically for information on how to analyze large amounts of sound recordings. These tools can be used for simply counting the number of USVs, calculation the “on time” or even classifying different call types (see the SASLab Pro manual).
Basic Analysis of USV’s
This section describes the most common type of analysis on rat or mouse USV’s in behavioral and psychopharmacological studies. Such studies often require relatively simple descriptive statistics parameters such as the total number of calls within the observation interval, the mean call duration and the relative ‘on’ time (the sum of call duration’s referenced to the observation interval).
1) Adjusting the spectrogram parameters from the main window command ‘Analyze’/’Spectrogram Parameters…’ . These settings will influence the time and frequency resolution of the spectrogram.
It is recommended to keep the FFT size and the overlap as small as possible, which will lead to a faster processing speed. However, if you are interested in the fine structure of the calls, the overlap (for a higher temporal resolution) or the FFT size (for a higher frequency resolution) can be increased. The window type (FlatTop or Hamming) will also influence both frequency and time resolution.
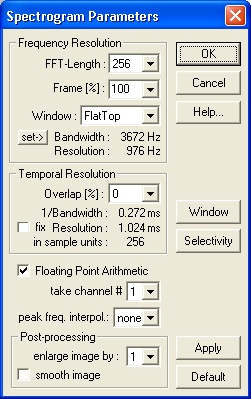
2) Creating a spectrogram of the entire observation interval (e.g. 1 or 10 minutes) by clicking at the OK button (for subsequent analyses, you can immediately create a spectrogram from ‘Analyze’/’Create Spectrogram…’
3) Setting up the Automatic Parameter Measurements from the spectrogram window command ‘Tools’/’Automatic parameter measurements’/’Automatic parameter measurements setup…’ .
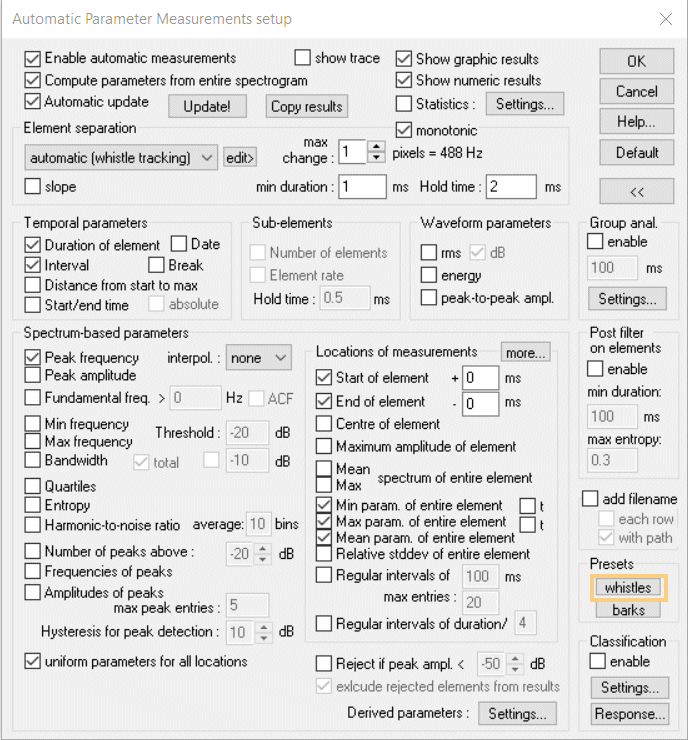
It is crucial to adjust the ‘Element separation’ properly in order to detect all USV’s safely. The “whistles” preset button on the right-hand side of the dialog box can be used to retrieve typical settings for the analysis of rat and mice USV’s. Details on how to optimize the element (call) detection can be found in the tutorial Measuring sound parameters from the spectrogram automatically.
In some cases it might happen that not all USV’s are recognized properly. In that case it would still be possible to edit the automatically detected calls manually. This can be done by clicking at the edit> button next to the Element separation list box on the Automatic Parameter Measurements setup dialog box, which will convert the detected elements into section labels. These section labels can be edited and deleted by mouse (drag the labels or right-click at them to delete the label by clicking at the Delete button on the Label editing popup dialog box). New labels for undetected calls can be added by left-clicking and dragging.
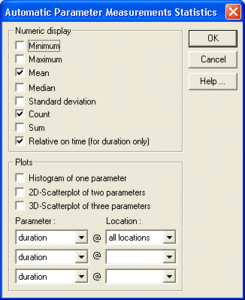
The descriptive statistics can be activated from the Statistics Settings button on the Automatic parameter measurements dialog box:
The results of the automated measurements will then be displayed in a separate window:
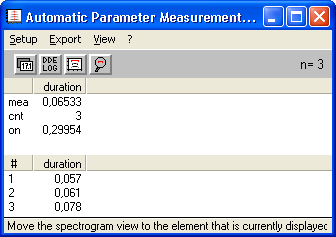
These results can be copied from the command ‘Export’/’Copy parameter measurements values’ and ‘Export’/’Copy parameter measurements statistics’ into another application such as Excel.
In addition to the above described procedure, it is also possible to acquire a few basic measurements in real-time by using the USV Real-time Monitoring tool.
For presentation purposes it is sometimes desired to create a slowed-down version of the original USV recordings that can be heard by humans. This can be accomplished as follows:
1. Launch the drop-down menu Edit > Format > Change Fileheader Sampling Frequency / Time expansion…
2. Select here a low sample rate (fs), such as 22050 or 11025 Hz.
3. Save the modified file from File > Save As…
For general information on the current research on rat USV see the article Ultrasonic vocalizations in rodents.