
SASLab Manual
| |
Main window : Analyze > Specials > Pulse Train Analysis
|
|
The Pulse Train Analysis tool can automatically measure the temporal structure of waveforms. This includes both simple counting of sound bursts or calls and even more complex measurements such as inter pulse intervals and pulse group analysis.
There are various envelope tracking and pulse recognition algorithms that can be selected depending on the type of signals to be analyzed.
The Pulse Train Analysis procedure consists of the following steps:
- Generating the envelope of the waveform,
- Pulse detection on the envelope,
- Post filtering (optionally rejecting gaps and short pulses)
- Pulse counting, measuring inter pulse intervals, durations, amplitudes and time stamps
- Group analysis for identifying pulse groups that are separated from each other by longer breaks (optional).
The Pulse Train Analysis tool is usually launched from the main window command Analysis > Pulse Train Analysis....
The analysis can be limited to a subsection the entire sound file by marking a section before launching the Pulse Train Analysis tool.
Alternatively, it can be started from the Curve window when it already displays an envelope (Display > Pulse Train Analysis...).
Depending on the quality of the sound recordings it might be necessary to high-pass filter the waveform before applying the Pulse Train Analysis (main window command Edit > Filter > Time Domain IIR Filter...).
This procedure will remove irrelevant low-frequency noise that might otherwise prevent a proper envelope analysis. Similarly, it is possible to run the Pulse Train Analysis directly on a spectrogram slice taken from the spectrogram window
(first activate Display > Additional Spectrogram Information > Time axis > Single frequency or Frequency Interval and then transfer the frequency slice into the curve window by double-clicking at the graph or via File > Data Export > Copy Envelope into Curve window.
The envelope of the currently loaded sound file and the detected pulses will be displayed in a separate Curve window:

In addition to that, a Pulse Train Analysis panel is launched. It allows adjusting the analysis settings and displays the results numerically:

For the proper operation of the Pulse Train Analysis tool it is essential that the analysis parameters (time constant, threshold, ...) and the analysis methods have been selected properly. It is usually required to optimize the settings interactively until it provides the desired results.
The Settings... button allows to setup the available analysis methods and the desired measurements.
time constant When the Pulse Train Analysis is launched from the main window, the envelope of the marked section is computed automatically. The time constant for that envelope computation can be entered here (unit milliseconds). Click at the Update button for re-computing the envelope with the newly entered time constant. The envelope computation method can be selected from the Settings dialog box. The value of the time constant (and the envelope computation method) will heavily influence the pulse train analysis results. So, that value should be adapted to the kind of signals to be analyzed. Generally, waveforms with low pulse rates and long pulses should be processed with larger time constants. Shorter pulses or higher pulse rates require shorter time constants.
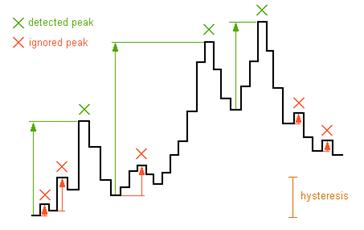
threshold The pulse detection is based on a threshold comparison on the envelope. Depending on the selected pulse detection method (Settings dialog), this threshold controls the pulse recognition. In the Gate Function method, a pulse is detected once the envelope exceeds the threshold level. In the Peak search with Hysteresis method, any peaks that do not exceed the threshold level will be ignored (the actual peak detection is controlled by the hysteresis parameter). The threshold level can also be entered visually by dragging its graphic representation on the envelope curve display. The rel. option will specify the threshold level relative (expressed in dB) to the peak of the entire envelope curve. Use this option to compensate for varying signal amplitudes.
hysteresis If the pulse detection method Peak search with Hysteresis has been selected, then the hysteresis parameter controls the peak detection (in conjunction with the threshold parameter). The underlying algorithm searches for local peaks in the envelope. A peak is recognized when its peak amplitude exceeds the minimum amplitude that precedes this peak by a predefined factor. This factor that is expressed in dB (the hysteresis parameter) should be adjusted in such a way that the relevant peaks are still recognized, while smaller irrelevant noise peaks are ignored. As a rule of thumb, the hysteresis parameter should be set to a value slightly lower than the signal to noise ratio of the recording (where the reverberation is also considered as noise). In most cases a hysteresis between 10 and 20 dB is appropriate. Please note that the pulse detection results are influenced both by the hysteresis and the time constant of the envelope generation.
start/end threshold If the pulse detection method Peak search with Hysteresis and the measurement option Duration have been selected, the start/end threshold controls the pulse duration and time stamp measurements. This relative threshold is referenced to the peak amplitude of each pulse. Therefore, lower values (e.g. -20 dB) will provide longer durations than higher values (e.g. -10 dB). For internal reasons, the absolute value of the start/end threshold parameter must be smaller than the hysteresis parameter. Therefore, the start/end threshold parameter will be decreased automatically when the hysteresis parameter becomes smaller than the start/end threshold.
group time If the Group Analysis option has been activated from the Settings dialog, then this group hold time parameter determines which pulses are grouped together. All pulses that are closer than the group time parameter will be associated to a single group. So, this parameter should be set to a value that is significantly larger than the longest break between the pulses that should be assigned to a single group. The group time is expected in milliseconds and applies to the time intervals between the start of a pulse and the end of the preceding pulse. If there is no information on the duration (method Peak search with Hysteresis and the Duration option not activated), then the start and end of a pulse is the same and the group time simply applies to the inter-pulse interval.
Post filter
The post filter allows to further improve the reliability of the pulse detection mechanism (only available for the method Gate Function). Short gaps within a sound burst can be rejected so that originally two close pulses are treated as a single element. Similarly, single short pulses can be rejected.
enable This check box enables the Post Filter. Certainly in conjunction with the pulse detection method Peak search with Hysteresis, there are several parameter settings that all influence the final pulse detection. Therefore, it is recommended to disable the post filter until the threshold and hysteresis parameters have been adjusted properly.
hold time The hold time controls the rejection of short gaps. Any gap shorter than the hold time will be rejected.

pulse detection without hold time

pulse detection with a post filter hold time set to 16 msec
min dur. The minimum duration parameter controls the rejection of short single pulses. Pulses shorter than the min dur. parameter will be rejected.
The hold time and min dur. entries require to confirm the modification made by clicking at the Update! button in order to re-compute the results.
Close Closes the Pulse Train Analysis tool.
Update! Reads the current settings from the parameter edit boxes and updates the pulse train analysis results.
Pulse analysis results
The results of the pulse train analysis are displayed in the list box on the left. Only those measurements that have been selected from the Settings dialog will be listed here.
Copy Copies the contents of the pulse list into the Windows clipboard. The ASCII-formatted table can then be pasted into another application (e.g. Excel). The data can optionally be transferred via DDE or written into a LOG file. The required settings can be made from the DDE / LOG button on the Settings dialog box.
Save Saves the list into an ASCII-formatted .txt file.
Head The column titles of the results list will be copied into the clipboard. This may help identify the various entries in the list.
Label The Create Labels dialog allows creating labels from the detected pulses.
Overall measurements : Pulses
The Overall Measurements selected from the Settings dialog are displayed on the right-hand side of the pulse list.
Copy The Copy button located at the top of the Pulses section will copy the above overall measurements into the clipboard.
Group analysis results
The results of the group analysis are displayed in the list box below the pulse list at the bottom of the window. Only those Group Analysis Measurements that have been selected from the Settings dialog will be listed here.
Copy Copies the contents of the group list into the Windows clipboard. The ASCII-formatted table can then be pasted into another application (e.g. Excel).
Optionally, the data can be transferred via DDE or written into a LOG file. The required settings can be made from the DDE / LOG button on the Settings dialog box.
Save Saves the list into an ASCII-formatted .txt file.
Head The column titles of the list will be copied into the clipboard. This may help identify the various entries in the list.
Label The Create Labels dialog allows creating labels from the detected pulse groups.
Overall measurements : Groups
The Overall Measurements selected from the Settings dialog are displayed on the right-hand side of the groups list at the bootom ofthe window.
Copy The Copy button located at the top of the Groups section will copy the above overall group measurements into the clipboard.
|
|