
SASLab Manual
| |
Spectrogram window : Display > Additional Spectrogram Information
|
|
The Additional Spectrogram Information dialog box allows displaying further information on the signals represented on the spectrogram.
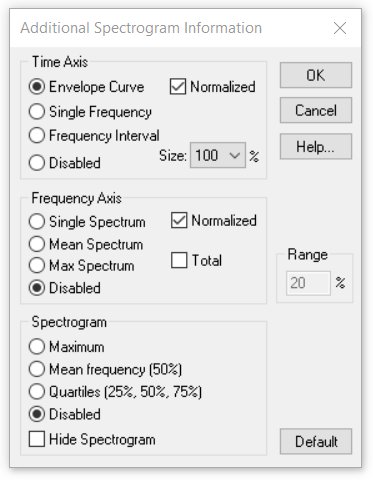
The available options are divided into information along the Time axis, along the Frequency axis and on the Spectrogram.
Time Axis
Envelope Curve The envelope of the waveform is displayed above the spectrogram. The Show rms option will additionlly show the root mean square trace of the waveform.

Single Frequency The intensity of a single frequency bin along the time axis (defined by a frequency cursor) is displayed above the spectrogram. The free frequency cursor can be activated from the command Tools > Cursors > Insert frequency cursor.
Frequency Interval The intensity of a frequency interval along the time axis defined by two frequency cursors is displayed above the spectrogram. The frequency cursors can be activated from the command Tools > Cursors > Insert frequency cursor.
Disabled Disables any additional information along the time axis.
Size Relative height (vertical size) of the curve display.
Frequency Axis
Single Spectrum The instantaneous spectrum at the left margin of the marked section is displayed.
Mean Spectrum The mean (averaged) spectrum of the marked section is displayed.
Max Spectrum The maximum amplitudes (envelope) over all instantaneous spectra of the marked section are displayed.
Disabled Disables any additional information along the frequency axis.
The Normalized options will normalize the additional spectrogram information data sets so that the graph fills the entire available space. Use this option for analyzing signals with varying levels.
If the normalized display is disabled, the displayed range is defined by the edit box Range that accepts values between 0.1 and 100 % of the full-scale range.
The option total will calculate the Mean and Max spectra always from the entire spectrogram (not only from the currently visible or marked section).
Spectrogram
Maximum The maximum of the instantaneous spectra (peak frequencies) will be determined and indicated by red lines on the spectrogram.
Mean frequency (50%) The mean frequencies of the instantaneous spectra (spectral centroid) will be determined. Red lines will visualize the course of the mean frequency. This kind of display can be used for evaluating noisy signals.
Quartiles (25%, 50%, 75%): The quartiles (percentiles) of the instantaneous spectra will be determined. Solid lines will visualize the progress of each quartile. The instantaneous spectra will be integrated and divided into four equal parts. The three frequencies dividing the area below the magnitude spectrum into four parts are called quartiles. This kind of display can be useful for evaluating noisy signals. The distance between the lower (25%) and upper quartile (75%) is a measure of the pureness of sounds.
The evidence of the quartiles can often be improved by averaging the spectrogram using the function Tools > Image Filter: Average
The red lines of the additional information Maximum, Mean frequency and Quartiles will be drawn only at those points in time where the maximum of the instantaneous spectrum exceeds a certain threshold. This threshold is controlled by the intensity setting of the spectrogram display, which can be adjusted using the vertical scroll bar on the Display > Display Parameter tool box.
Disabled Disables any additional information on the spectrogram.
Hide Spectrogram If this option is activated the spectrogram itself will not be displayed. This may improve the readability of the Maximum, Mean frequency and the Quartiles.
The Default button retrieves the default settings that hide the available additional spectrogram information.
|
|