SASLab Manual
| |
|
|
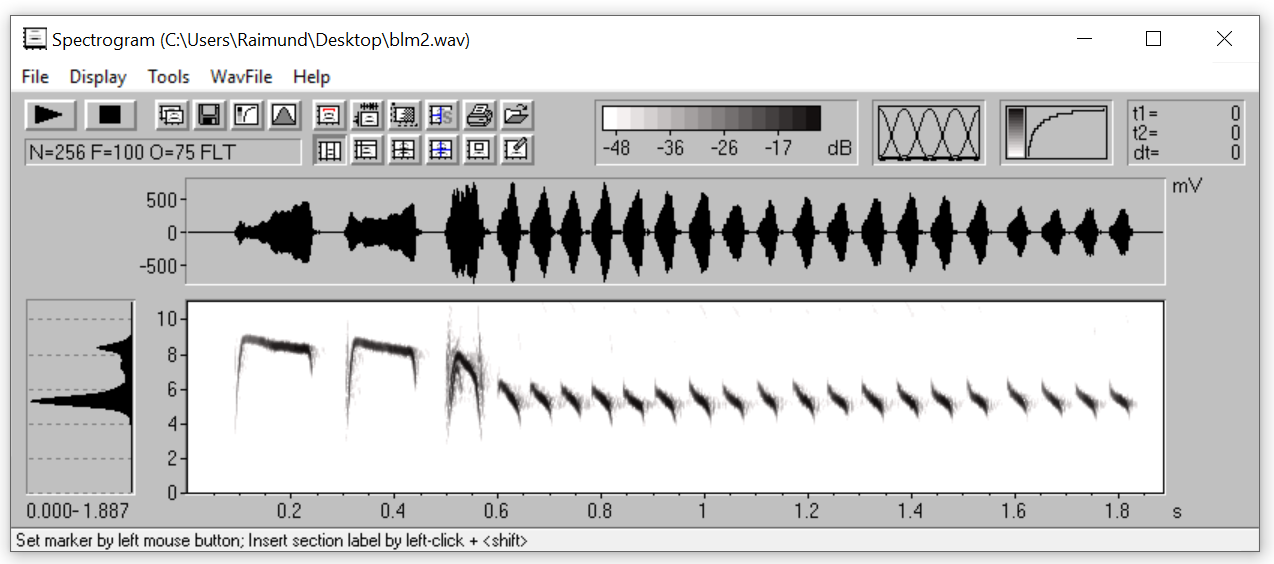
The spectrogram window is launched from the main window command Create Spectrogram  .
It supports in-depth spectrographic analysis and measurements. The time and frequency resolution of the spectrogram can be adjsuted from the main window command Spectrogram Parameters... .
It supports in-depth spectrographic analysis and measurements. The time and frequency resolution of the spectrogram can be adjsuted from the main window command Spectrogram Parameters...  or from the the specrogram window drop-down command WavFile > Spectrogram Parameters...
  . .

Measure time and frequency parameters either manually using the cursors (Tools > Cursors>) or automatically using the Automatic Parameter Measurements tool (Tools > Automatic parameter measurements  ). ).
Export spectrogram images as grapgics files (File > Save Spectrogram Image...  ) or through the Windows clipboard (File > Copy Spectrogram Image ) or through the Windows clipboard (File > Copy Spectrogram Image  ). ).
The Spectrogram window contains the following drop-down submenus:
File
Display
Tools
WAVFile
|
|