
SASLab Manual
| |
Main window : Analyze > Spectrogram Parameters...
|
|
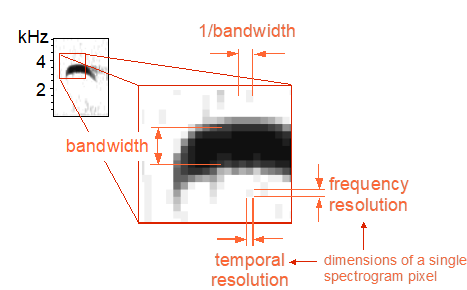
The spectrogram parameters determine the resolution of the spectrogram along the time and frequency axis. The frequency resolution (corresponding to the filter bandwidth of analog spectrographs) is determined by the sampling frequency, the FFT length, the frame size and the window type. The bandwidth of a spectrogram should be adapted to the signals to be analyzed. The inverse of the bandwidth determines the temporal resolution of the spectrogram.
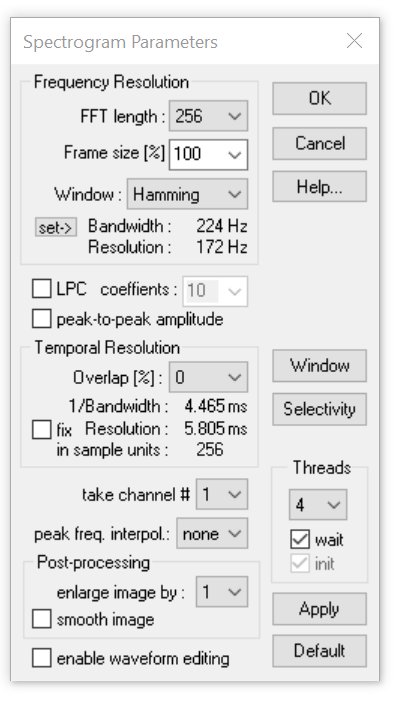
The following parameters can be adjusted:
Frequency Resolution
FFT Length One half of the selected value corresponds to the spectrogram height. High values result in high frequency resolution and low time resolution. For normal applications an FFT length of 256 points should be used.
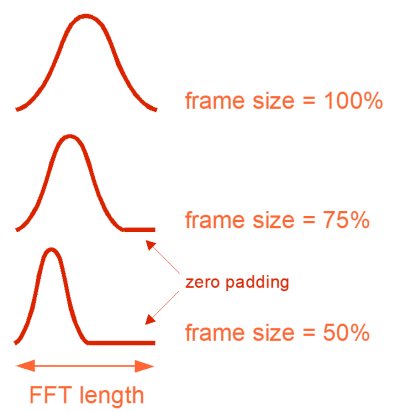
Frame size [%] The frame size determines the percentage of the FFT length that is actually used for the spectrum computation (zero-padding). Low values will result in a higher temporal resolution, which is also accompanied by a lower frequency resolution. A frame size of 100% is recommended for normal applications.
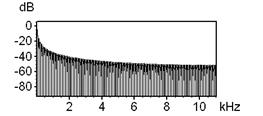
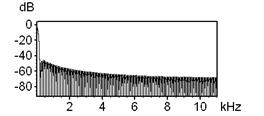
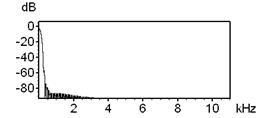
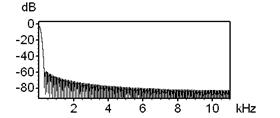
Window The evaluation window determines the suppression of unwanted spectral distortion (so called side lobes that occur in stationary signals that are longer than the FFT window size) and the analysis bandwidth. The available window types are Rectangle, Hamming, Hann, Blackman, Bartlett (triangle), FlatTop, KaiserBessel and Gauss. The FlatTop or Hamming windows provide the best results in most cases. The FlatTop window provides a flat top band-pass filter characteristic that is ideal for taking precise magnitude measurements.
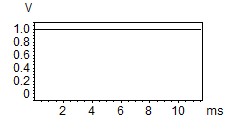
| Rectangle |
 |
 |
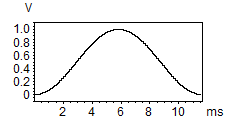
| Hamming |
 |
 |
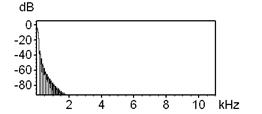
| Hann |
 |
 |
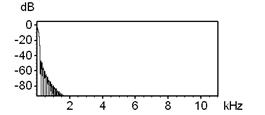
| Blackman |
 |
 |
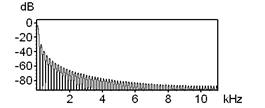
| Bartlett | 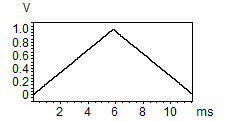 |
 |
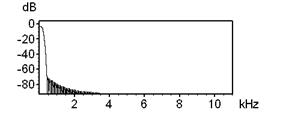
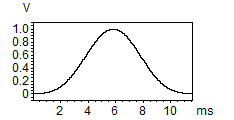
| FlatTop |  |
 |
| Kaiser-Bessel |
 |
 |
| Gauss 3.0 | 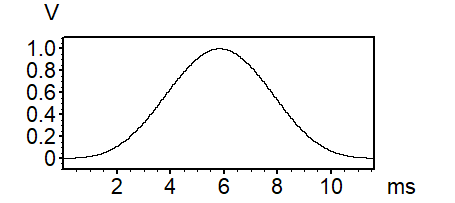 |
 |
Bandwidth The bandwidth depends on all three parameters (FFT length, Frame size, Window) and the sampling frequency of the sound file. In contrast to the resolution, the bandwidth is the true physical filter bandwidth, which is usually larger than the Resolution.
Use the set-> button to set the bandwidth directly.
Resolution The frequency resolution depends on the FFT length and the sampling frequency of the sound file. In contrast to the bandwidth, the frequency resolution corresponds to the height of one pixel of the spectrogram (frequency bin width = sample rate / FFT length).
LPC The LPC option activates an additional Linear Prediction Coding procedure that is applied to the waveform before calculating the spectrogram. The LPC analysis option creates a smooth spectral envelope that indicates the major energy peaks. In primate vocalization analysis, it can help to track the formant characteristic. The number of the prediction coefficients determines the accuracy of the resulting smooth spectral envelope. The implemented LPC algorithm is based on the least-square estimation technique by using autocorrelation.
peak-to-peak amplitude This option determines the broad-band peak-to-peak amplitude within the FFT frame and outputs this amplitude at the frequency bin that corresponds to the peak frequency of the FFT spectrum. All other frequency bind of the spectrum will be set to zero. Use this option to measure the amplitudes of very short pulses that would otherwise be averaged out (rejected) by the FFT.
Temporal Resolution
Overlap The spectrogram is generated by repeatedly computing of spectra of a sliding window through the time data. The overlap is the step width between two neighbor spectra. Rising overlap values result in higher time resolutions. An overlap of 50% is recommended for most applications. Note that high values for overlap do not increase the visible information in the spectrogram if the frame size is not reduced in an equivalent way. The relation between frame size and overlap is displayed graphically on the top of the window.
1/Bandwidth This is the reciprocal of the bandwidth or time constant.
Resolution The temporal resolution is the duration of a pixel of the spectrogram. The true physical time constant may be different (depending on the selected parameters) from this resolution.
fix When this option is activated and the FFT length parameter is modified, the Overlap parameter will be altered automatically in order to keep the temporal resolution fixed.
peak freq. interpol. The peak frequency detection in the spectrogram window is based on a maximum search on the spectra. In order to increase the precision of the peak frequencies beyond the spectrogram resolution, an interpolation algorithm is used. This parameter determines the number of points used for interpolation. The option none will inhibit the interpolation, which means, that the peak frequency resolution is equal to the spectrogram resolution. The option auto will select the optimal number of interpolation points for a given bandwidth.
take channel # In multi-channel files, this option determines, from which channel the spectrogram will be generated. In stereo files the left channel is channel # 1.
Post-processing The following optional post-processing procedures are applied to the spectrogram generated using the parameters selected above. They do not increase the frequency or temporal resolution. The enlarge and smooth option can be used to improve the appearance of printed spectrograms.
enlarge image by The spectrogram image is enlarged by the specified factor. This option is equivalent to the menu Tools/Enlarge image in the spectrogram window.
smooth image The spectrogram image is smoothed. This option is equivalent to the menu Tools/Image Filter: Average in the spectrogram window.
enable waveform editing This option enables the use of the spectrogram window command Tools/Remove erased spectrogram sections from waveform.
Window This button will show a detailed graphical display of the selected Evaluation Window.
Selectivity This button will show a detailed graphical display of the frequency selectivity of the selected Evaluation Window.
Threads This list box determines the number of threads that are being used for calculating the spectrogram both on the main and the spectrogram window. When running the software on a multicore processor, the selected number of threads should be at least equal the number of cores (or processor threads) in order to speed-up the calculations. Depending on the capabilities of the specific computer (such as the hard drive data transfer rate for instance), multithreading can also be slower than the single-thread mode. In that case, a thread number of 1 should be selected.
wait If more than one thread has been selected and this option is not activated, the spectrogram window will be launched before the spectrogram has been completed, which can accelerate the workflow. However, this may also lead to problems in conjunction with the Automatic Parameter Measurements tool.
init When the above wait option is not activated, the ini option will indicate the uncompleted parts of the spectrograms by well-defined pattern. This initialization will however consume additional time.
Apply Use this button to re-calculate the spectrogram using the current settings without closing the dialog box. This may accelerate the process of finding the best parameter settings.
Default Sets the standard values for all settings.
|
|