SASLab Manual
| |
|
|
Create Spectrogram  Creates a detailed spectrogram that is displayed in a separate spectrogram window with advanced functionalities (the spectrogram overview display on the main window provides only limited capabilities).
The spectrogram parameters can be adjsuted from the Spectrogram Parameters... Creates a detailed spectrogram that is displayed in a separate spectrogram window with advanced functionalities (the spectrogram overview display on the main window provides only limited capabilities).
The spectrogram parameters can be adjsuted from the Spectrogram Parameters...  dialog box.
By marking a subsection of the sound file on the main window, the spectrogram can be limited to that interval. dialog box.
By marking a subsection of the sound file on the main window, the spectrogram can be limited to that interval.
Open Binary Speectrogarmm... Opens binary spectrogram files (.son) that have been saved from the sepctrogram window command File > Save Spectrogram (ASCII/Binary)...
Spectrogram Parameters... 
Spectrogram Overview  This option activates a spectrographic overview display on the bottom of the main window. This option activates a spectrographic overview display on the bottom of the main window.
Overview Parameters... 
Apply spectrogram window parameters Applies the spectrogram parameter settings (including FFT overlap) made for the spectrogram window to the main window overview display.
Show Y axis grid This option enables a Y axis grid and the associated labels.
Measurement mouse cursor  This option activates a crosshair cursor for measuring time, amplitude and frequency. This option activates a crosshair cursor for measuring time, amplitude and frequency.

Show root mean square trace  This option activates a root mean square trace on the waveform display for measuring sound levels using a measurement cursor. This option activates a root mean square trace on the waveform display for measuring sound levels using a measurement cursor.
Amplitude cursor This option activates a horizontal amplitude cursor for measuring sound levels on the waveform overview display of the main window. The amplitude cursor can alternatively be activated by pulling it out of the upper margin of the waveform display.
Amplitude cursor unit > Selects the unit of the amplitude cursor numeric display:
dB dBFS (negative) or dBSPL, dBu, dBV after calibration
mV or mPa
% FS Percent of the full scale
Frequency cursor This option activates a horizontal frequency cursor for measuring frequencies on the spectrogram overview display on the bottom of the main window. The frequency cursor can alternatively be activated by pulling it out of the upper margin of the spectrogram display.
Step waveform display mode This option activates the step display mode on the (high temporal resolution) graphic representation of the waveform:
activated:  , deactivated: , deactivated: 
Fast Envelope Curve display Toggles between fast and exact envelope curve display mode. If this option is activated, the display will be drawn faster at the expense of accuracy (some waveform patterns may be rejected).
Time axis format...
Show UltraSoundGate DIO This option displays the UltraSoundGate DIO track that is available on a number of the Avisoft-UltrasSoundGate recording and playback devices.
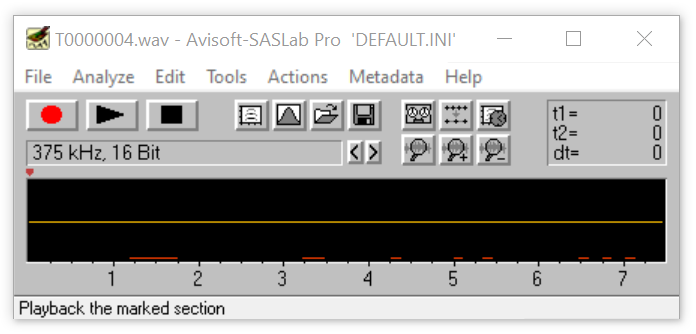
UltraSoundGate DIO display style > Determines how the UltraSoundGate DIO track is visualized. The options 1...4 show the active DIO track signal as red lines with different line widths (1 to 4 pixels) at the bottom of the waveform display:

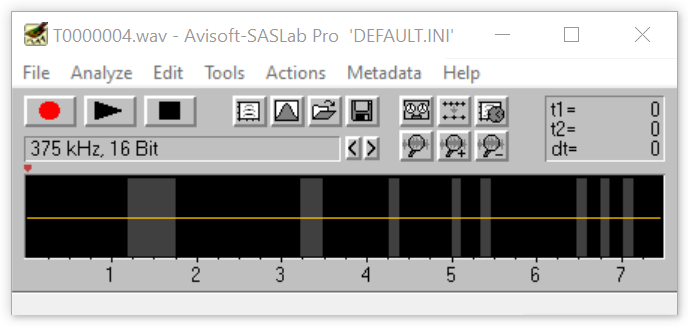
The option gray background indicates the active DIO signal by a gray rather than a black background of the waveform display:

One-dimensional Transformation... 
Pulse Train Analysis...
Specials >
|
|