
SASLab Manual
| |
Synthesizer window : Tools > Scan harmonics from spectrogram based on fundamental
|
|
The amplitudes of the harmonics are extracted from the spectrogram that is visible in the Spectrogram window (use the option View > Display spectrogram to show the spectrogram).
The fundamental frequency curve must have been specified before by manual drawing in the Fundamental frequency section or by the Scan frequency contour spectrogram function. If the signal to be scanned has many harmonics it may be useful to manually trace a higher harmonic instead of the fundamental itself. The drop-down menu option Scaling can then be used to multiply the frequency scale by a factor (e.g. 0.25 if the 4th harmonic was traced) in order to get more precise fundamental frequency measurements.
The accuracy of the scanning procedure is influenced by the quality of the spectrogram, its resolution and the precision of the fundamental frequency curve supplied. The precision of the fundamental frequency curve is especially important for high-order harmonics. For scanning the 7th harmonic, the specified fundamental frequency is multiplied by 7 and the amplitude at that frequency position in the spectrogram is taken as the amplitude of the 7th harmonic.
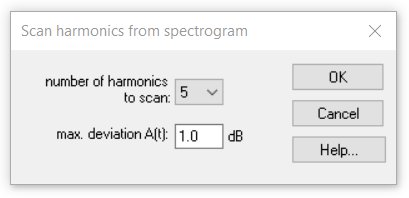
number of harmonics to scan This list box determines the number of harmonics that will be traced. This value can be any integer between 0 and 7. Zero means that only the fundamental itself is scanned.
max. deviation A(t) This value determines the accuracy of the amplitude trace. It is expressed in percent of the maximum magnitude of the entire spectrogram. Larger values will produce fewer samples in the amplitude plot, which may simplify further editing. In order to get maximum fidelity it is recommended to set this value to zero.
|
|