
SASLab Manual
| |
Spectrogram window : Tools > Cursors > Magic Cursor Setup
|
|
This dialog box defines the behavior of the magic reticule cursor.
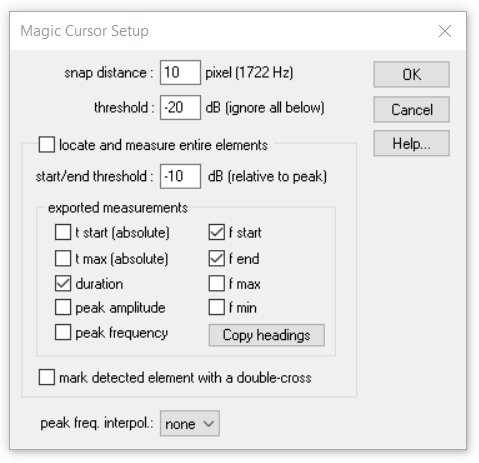
snap distance This value determines the distance between the current vertical cursor position and a real peak in the spectrogram, at which the cursor would then snap automatically. This distance is expected in spectrogram pixels. The resulting frequency interval is shown behind this edit field. If you need to investigate single close-spaced frequency bands, this parameter should be set smaller than the distance between these frequency bands. Larger values will make it easier to locate peaks, because it is then not required to place the cursor so close to the peak.
threshold This absolute threshold limits the automatic peak detection mechanism to regions that exceed a certain amplitude. This threshold is expected in dB relative to the full scale (0 dB corresponds to a full-scale signal). When setting this threshold to a low value (e.g. -40 dB), the magic cursor will be able to locate also low peaks. In noisy recordings however, this would lead to peaks within in the noise floor that are out of interest. It might therefore be better to use a higher threshold. Higher thresholds may of course prevent locating smaller peaks.
locate and measure entire elements
If this option is activated, the magic cursor will not only find the peak frequency (and amplitude) at the current (horizontal) cursor position. The peak-search will be extended to the peaks before and after the current horizontal cursor position.
By defining appropriate thresholds, this mechanism also allows to locate and measure entire elements. The start and end of each element to be recognized is derived from the amplitude across each potential element. The algorithm starts at the maximum peak amplitude of the element and searches those points, where the amplitude goes below a pre-defined threshold (start/end threshold). The resulting points are assumed to be the start and end of the element. The corresponding frequency measurements (f start, f end, f max, f min) are then taken from that section.
This automatic recognition process will only work satisfying if the signals to be measured are relatively clearly structured and if they do not contain too much noise or reverberation. The settings (snap distance, threshold, start/end threshold) will strongly affect the results.
start/end threshold This threshold determines the begin and end of the automatically recognized elements. In contrast to the above threshold, this relative threshold is referenced to the maximum peak amplitude of each element. Therefore, 0 dB corresponds to the absolute amplitude of the peak and not to a full-scale signal. Larger values (e.g. –10 dB) would lead to shorter element duration estimates. Lower values (e.g. –20 dB) would provide longer element durations.
exported measurements
The following measurements can be exported by clicking the left mouse button. The activated parameters will be copied into the clipboard (and optionally transferred via DDE or saved into a LOG file if the appropriate settings were made from File > Data Export/DDE Parameters / Log-File.
t start (absolute) The absolute start time of the element in seconds.
t max (absolute) The absolute time of the peak amplitude of the entire element in seconds.
duration The duration of the element in seconds.
peak amplitude The peak amplitude of the entire element in dBFS (relative to full-scale).
peak frequency The frequency at the point of the maximum amplitude of the entire element in Hz.
f start The frequency at the start of the element in Hz.
f end The frequency at the end of the element in Hz.
f max The maximum peak frequency over the entire element in Hz.
f min The minimum peak frequency over the entire element in Hz.
Note that the start and end of the elements are derived from the spectrogram, which slightly over-estimates the durations of sound structures. This over-estimation is caused by the smearing effect of the FFT window. This effect will become significant in larger overlap settings. The amount of over-estimation equals about half the duration of the FFT window (0.5 * FFT length / sampling rate). It also depends on the window type and the frame size.
Copy headings
This button copies an ASCII description of the currently activated measurements, which can help in identifying the exported measurements.
mark detected element with a double cross
If this option is activated, the recognized elements will be marked with two vertical and horizontal thread-crosses showing both start/end and the maximum/minimum frequencies. Otherwise, the element is marked with an enclosing rectangle.
peak freq. Interpol.
The peak frequency detection on the spectrogram is based on a maximum search on the spectra. In order to increase the precision of the peak frequencies beyond the spectrogram resolution, an interpolation algorithm can be applied.
This parameter determines the number of points used for interpolation. The option none will inhibit the interpolation, which means that the peak frequency resolution is equal to the spectrogram resolution. The option auto will select the optimal number of interpolation points for a given bandwidth. This interpolation will not be applied to f start, f end, f max and f min (only to the peak frequency).
|
|