
SASLab Manual
| |
Curve window: Display > Spectral Characteristics...
|
|
The Spectral Characteristics tool provides a number of parameters describing magnitude and power spectra.
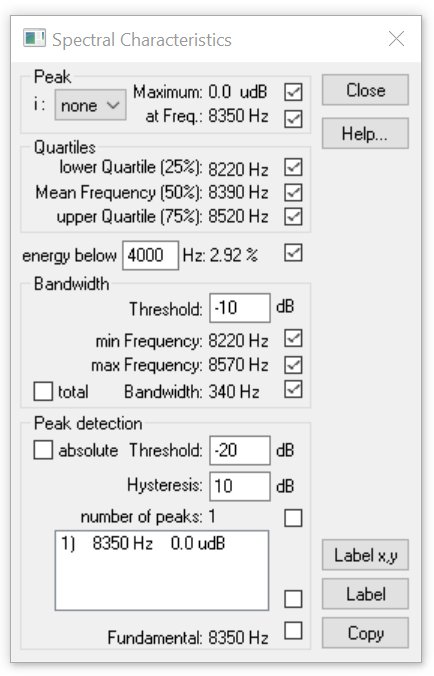
The following parameters will be displayed:
Maximum: The maximum amplitude of the spectrum.
at Frequency: The frequency at the maximum.
Quartiles
The Quartiles parameters characterize the distribution of energy across the spectrum. The spectrum will be integrated and divided into four equal parts. The three frequencies dividing the magnitude spectrum into four parts are called quartiles.
lower Quartile (25%): 25% of the total energy is located below this frequency.
Mean Frequency(50%): The mean frequency of the spectrum. Below this frequency is 50% of the total energy.
upper Quartile (75%): 75% of the total energy is located below this frequency.
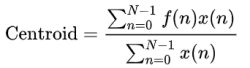
Spectral centroid: The centroid represents the weighted mean of the spectrum with the magnitudes as the weights:
Energy below xxxxx Hz: The fraction (expressed in %) of the total energy that is allocated below the specified frequency.
Bandwidth
Threshold: This edit field determines the threshold for the computation of the following cut-off frequencies. Note that this value has different meanings for magnitude and power spectra.
min Frequency, max Frequency: These values indicate at which frequencies the amplitude falls short of the maximum of the spectrum minus the threshold.
Bandwidth: The bandwidth is the difference between the max and min Frequency.
If the total option is checked, the min and max search is started from the left (for min) and the right (for max) margin of the curve window. Otherwise the min and max search is started from the maximum.
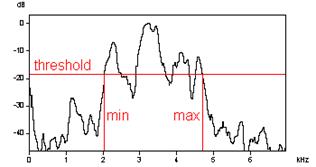
Min and Max frequency detection with the total option activated.
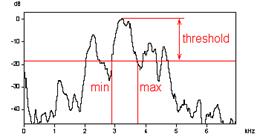
Min and Max frequency detection with the total option not activated.
Peak detection
This section supports the localization of local peaks in the frequency spectrum.
Threshold: Only peaks exceeding this threshold will be considered. If the absolute option is activated, the threshold value is interpreted as an absolute value. Otherwise, the threshold value is related to the maximum of the spectrum.
Hysteresis: Only such local peaks that are higher than the preceding valley plus this hysteresis will be detected as peaks.
number of peaks: The number of detected peaks is shown here.
The listbox below shows the results of peak detection. The index number of the peak is followed by frequency and amplitude of that peak. The maximum number of peaks that can be detected is 16.
Fundamental: If possible, the fundamental frequency is derived from the frequencies of the detected peaks. If fundamental frequency determination is not possible (no harmonic structure), this measure will be zero.
The Close button closes the window.
The Copy button will copy these measurement values into the Windows clipboard. Only those values, which have been marked by the check boxes behind the values will be copied. Tabulators separate the single values. A complete data set is terminated by CR/LF control character.
|
|