
SASLab Manual
| |
Spectrogram window : Tools > Automatic parameter measurements > Automatic parameter measurements setup
|
|
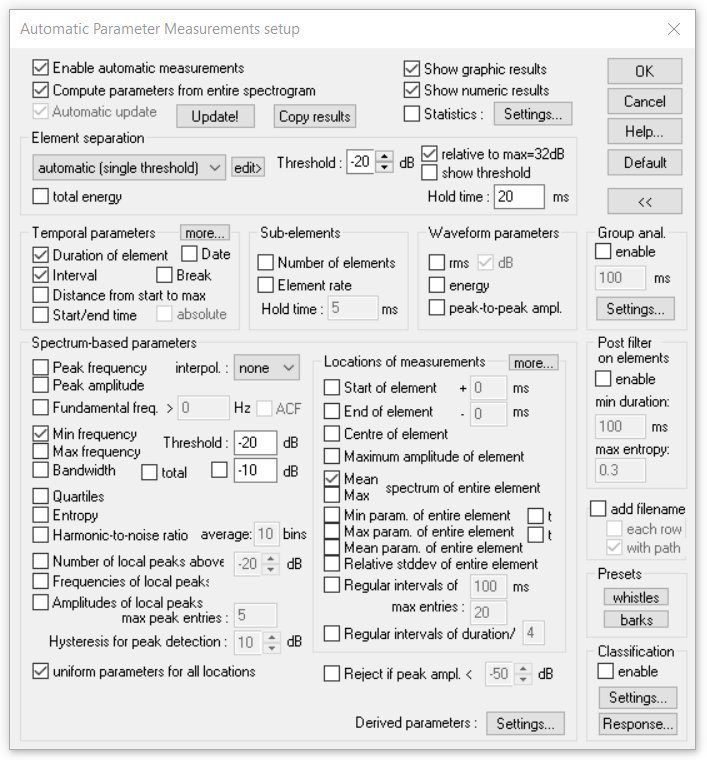
The Automatic Parameter Measurements setup dialog box defines the measurements to be taken from the spectrogram.
Enable automatic measurements Activates the automatic parameter measurements tool.
Compute parameters from entire spectrogram If this option is activated, the measurements will be computed from the entire spectrogram file. Otherwise, only the currently visible or marked section will be analyzed. When this option is activated, it is necessary to use the OK or Update! button for updating the measurement results after modifying the settings.
Automatic update If this option is activated, the Automatic Parameter Measurements display will be updated each time the spectrogram window is redrawn. Otherwise, the measurements are only displayed and updated when the OK or the Update! button is clicked. Note that the automatic update is not executed when the above option Compute parameters from entire spectrogram is activated.
Update! This button will recalculate and update the Automatic Parameter Measurements displays without leaving the setup dialog box through the OK button. Use this button to quickly check the current settings.
Copy results Copies the measurements into the clipboard (see also Copy parameter measurement values  ). ).
Show graphic results If activated, the measurements will be visually indicated on the spectrogram. Use this option to quickly review the measurements taken.
Show numeric results If this option is activated, the results will be displayed in a separate Automatic Parameter Measurements results window.
Statistics If this option is activated, statistics on the automatic parameter measurements will be calculated according to
the Settings... defined on the Automatic Parameter Measurements Statistics dialog box.
Element separation The element separation (segmentation) can be accomplished by magnitude thresholds, spectral property thresholds or manually by marking the desired elements by section labels.
Temporal parameters
The temporal parameters are derived from the spectrogram.
Duration of element The duration of each element from start to end is measured.
Interval The duration from the start of the preceding element to the start of the current element is measured.
Break The silent interval from the end of the preceding element to the start of the current element is measured.
Distance from start to max The distance from start to the location of the maximum amplitude is measured.
Start/end time The start and end time stamps of each element is taken.
The additional option absolute will add the absolute time offset to the start/end time stamps. This absolute time offset is referenced to the start of the underlying sound file. If the sound files have been recorded by Avisoft-RECORDER, then the time offset is referenced to the start of the monitoring. In this way it is possible to get a consistent time scale throughout subsequent (sequentially numbered) files.
Date The calendar date and time at the start of the element is copied into the results listing. This information is derived from the file creation date or the time chunk of the .wav files recorded by Avisoft-RECORDER.
more... Provides additional temporal parameters.
Sub-elements
The sub-element detection tool supports counting and measuring elements within phrases (groups of closely spaced elements) that are temporally separated. This option will only work if the intervals between the consecutive sub-elements are shorter than the intervals between the high-order elements (phrases). The sub-element detection is based on a secondary hold time mechanism, which has to be set to a value shorter than the interval between sub-elements (Hold time setting in the above Element separation section). The element separation hold time must be set to a value longer than the silent breaks between the sub-elements and shorter than the silent breaks between the high-order elements.
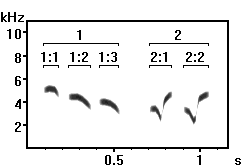
Example: 1 and 2 are the high-order elements (phrases) and 1:1, 1:2, 1:3 and 2:1, 2:2 are the sub-elements. In this example the element separation hold-time was set to 0.1 s and the sub-element hold-time to 0.01s.
Number of elements The number of sub-elements within an element (phrase).
Element rate The average rate of sub-elements within an element (phases). The unit of the element rate is 1 second.
Hold time This hold time should be set to a value shorter than the silent intervals between the consecutive sub-elements.
Note that the sub-elements option is not available with the element separation method automatic (whistle tracking). Use here instead the group analysis tool (Group. Anal.).
Waveform parameters
In contrast to the other parameters that are taken from spectrogram, the waveform parameters are derived directly from the underlying .wav file and are computed from the entire duration of the element.
rms The root mean square either in 1 Volt or dB units in case the dB option is activated.
energy The total energy of the element in Volt2*sec units.
peak-to-peak ampl. The peak-to-peak amplitude in 1 Volt units.

Group Anal. The group analysis option provides measurements on the temporal (meta) structure of subsequent sound elements that form groups (or phrases) that are separated by significant breaks. In contrast to the Sub-elements option, this option also provides detailed measurements on the elements that form the group.
Spectrum-based parameters
The spectrum-based parameters are derived directly from the individual instantaneous spectra that make up the spectrogram.
Peak frequency The peak frequency is the frequency of maximum power.
interpol. The peak frequency detection on the spectrogram window is based on a maximum search on the instantaneous spectrum. In order to increase the precision of the peak frequencies beyond frequency resolution of the spectrogram, an interpolation algorithm can be used. This parameter determines the number of points used for the interpolation. The option none will inhibit the interpolation, which means that the peak frequency resolution is equal to the spectrogram frequency resolution. The option auto will select the optimal number of interpolation points for a given bandwidth.
Peak amplitude The maximum amplitude (magnitude) of the instantaneous spectrum at the peak frequency.
Fundamental frequency This fundamental frequency detection tool is based on a local peak search on the spectrum. The implemented algorithm will detect the fundamental even if the fundamental component itself or single harmonics are weak or not present at all. In contrast to the Peak frequency option, which returns the frequency at maximum power, this option is relatively immune against varying amplitudes of harmonics in complex harmonic signals. See the description of Number of local peaks above and Frequencies of local peaks below for details on the peak detection mechanism. Threshold and hysteresis for the peak detection for the fundamental frequency are the same as for the local peak frequency search and can be edited from there. In complex (noisy) signals it may be useful to first setup the peak detection algorithm using the Number of local peaks above option. If all the peaks are detected properly, that option can be disabled and the Fundamental frequency option can be activated.
The fundamental frequency detection algorithm is prone to failure, which can lead to underestimated fundamental frequencies. This effect can be reduced by specifying a lower limit for the fundamental frequency (the lowest expected fundamental frequency is usually known in advance). The expected lower limit can be entered into the edit box labeled “>”
A fundamental frequency measure of 0 Hz indicates that the detection algorithm could not identify a valid harmonic structure (the detected peaks are no integer multiples of a potential fundamental). In that case try to modify the peak search Hysteresis or erase the noise components that might prevent a proper processing.
The option ACF activates an alternative autocorrelation method for estimating the fundamental frequency. Note that the autocorrelation method will only work satisfyingly for low fundamental frequencies (in relation to the sample rate). The results will become more and more inaccurate at higher frequencies.
Min frequency The minimum frequency is the frequency where the magnitude of the spectrum first undercuts the specified Threshold towards lower frequencies (if the total option is not activated). If the total option is activated, it is the frequency where the magnitude last undercuts threshold towards lower frequencies. See also illustrations below.
Max frequency The maximum frequency is the frequency where the magnitude of the spectrum first exceeds the specified Threshold towards higher frequencies (if the total option is not activated). If the total option is activated, it is the frequency where the magnitude last exceeds the threshold. See also illustrations below.
Bandwidth The bandwidth is the difference between the Max and Min frequency.
Thold This threshold is being used for finding the minimum and maximum frequency and the bandwidth. If the abs option is not activated, the relative threshold is referenced to the peak (maximum) amplitude of the spectrum.
If the abs option is activated, the thresholds are absolute and independent from the signal levels. An additional threshold can optionally be activated from the associated checkbox below the primary threshold edit field, which will take a second set of min/max/bandwidth measures.
abs If the abs option is activated, the bandwidth thresholds are defined in absolute units (dBFS or dBSPL after calibration) rather than referenced to the maximum. Note that the results can then be affected by the signal levels of the individual elements.
total The total option determines the way how min and max frequency and bandwidth are determined. If the total option is activated, the bandwidth will cover all local peaks that exceed the threshold. Otherwise, the bandwidth will only cover the maximum peak exceeding the threshold.
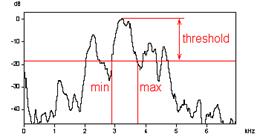
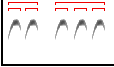
Min and Max frequency detection with the total option not activated.
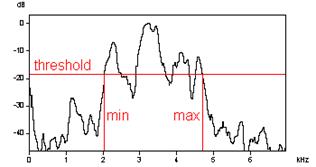
Min and Max frequency detection with the total option activated.
Quartiles These parameters characterize the distribution of the energy on the spectrum. The area below the spectrum will be integrated and divided into four equal parts. The three frequencies dividing the magnitude spectrum into four equal parts are called quartiles:
Quartile 25%: The first quartile (lower quartile or 25th percentile) splits off the lowest 25% of the spectrum from the highest 75%.
Quartile 50%: The second quartile (median or 50th percentile) cuts the spectrum in half.
Quartile 75%: The third quartile splits off the highest 25% of the spectrum from the lowest 75%.
The distance between the first and third quartile is a measure of the pureness of the sound.
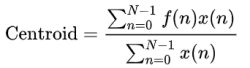
Spectral centroid The centroid represents the weighted mean of the spectrum with the magnitudes as the weights:
Entropy The Wiener entropy parameter quantifies the spectral flatness (or tonality) of a sound. It is the ratio of the geometric mean to the arithmetic mean of the spectrum. This parameter is (theoretically) 0 in pure-tone signals and 1 in random noise. Because of the properties of the discrete short-time FFT (its analysis bandwidth is always larger than zero), the value will not be exactly zero for a pure tone signal. The exact results will depend on FFT length, frame size and window type. Therefore, the entropy parameter should only be used for comparisons among spectrograms generated using the same spectrogram parameter settings.
Harmonic-to-noise ratio The harmonic-to-noise (HNR) parameter quantifies the ratio of harmonic to nonharmonic energy. The nonharmonic noise floor of the spectrum is estimated by calculating the moving average of the spectrum.
The maximum difference between the magnitudes of original spectrum and the filtered spectrum (expressed in dB) is taken as the HNR measure. The width of the averaging window can be defined by entering the number of frequency average bins.
Note that the HNR estimation is affected by the FFT size, the evaluation window type and the number of the averaging frequency bins. The default of 10 frequency bins usually works well with a FFT size of 256. The number should be scaled according to the selected FFT size (20 bins for 512 points and 40 bins for 1024 points).
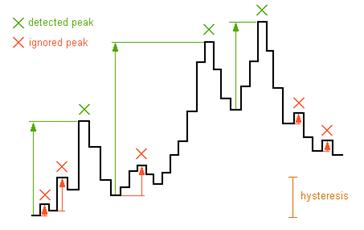
Number of peaks above -xx dB The number of local peaks (harmonics) exceeding this threshold is counted. The threshold is related to the maximum peak.
Frequencies of peaks The frequencies of the local peak are determined.
Amplitudes of peaks The amplitudes of each peak are determined.
max peak entries This value limits the maximum number of peaks in the output file. This value should be set to the expected maximum number of peaks.
Hysteresis for peak detection The hysteresis setting is being used for the local peak search. Only peaks that are higher than the preceding valley plus this hysteresis will be detected as peaks.
uniform parameters for all locations
If this option is activated, the selected Spectrum-based parameters will be taken at all selected Locations of measurements.
Otherwise, the spectrum-based parameters can be defined individually for each location, which would allow excluding unwanted combinations of certain parameters and locations that make no sense.
The list box Location allows navigating through the parameter settings of the various locations.
Locations of measurements
The parameters listed above can be computed at different locations within the element:
Start of element Instantaneous spectrum at the beginning (t1) plus the optional displacement specified in milliseconds.
End of element Instantaneous spectrum at the end (t2) minus the optional displacement specified in milliseconds.
Center of element: Instantaneous spectrum in the middle at (t1+t2)/2.
Maximum amplitude of element Instantaneous spectrum at the location of the maximum magnitude.
Max spectrum of entire element The parameters are derived from the maximum spectrum (peakhold) of the entire element.
Mean spectrum of entire element The parameters are derived from the averaged spectrum of the entire element. The peak frequency taken from the mean spectrum is also referred to as the peak frequency of the average spectrum.
The example below illustrates the differences between the options Mean and Max spectrum of entire element. Assuming a syllable consisting of a constant frequency and a frequency-modulated part having a constant amplitude throughout its duration, the mean spectrum would be dominated by the constant frequency part (most of the energy is concentrated at the constant frequency). In contrast, the max spectrum would have a flat top across the entire frequency range of the syllable, regardless of the duration of the constant frequency section.
Min param. of entire element The spectrum-based parameters are internally computed for all instantaneous spectra between the start and the end of each element. The minimum of the measurement values throughout all these spectra is determined. For instance, when applied to the peak frequency, the "min param of entire element" will return the lowest peak frequency within each element. Similarly, when applied to the entropy, it will return the lowest entropy that occurred between the start and end of each element. The option t will additionally measure the location of the minimum within the element.
Max param. of entire element The spectrum-based parameters are internally computed for all instantaneous spectra between the start and the end of each element. The maximum of the measurement values throughout all these spectra is determined. For instance, when applied to the peak frequency, the "max param of entire element" will return the highest peak frequency within each element. Similarly, when applied to the entropy, it will return the maximum entropy that occurred between the start and end of each element. The option t will additionally measure the location of the maximum within the element.
Mean param. of entire element The spectrum-based parameters are internally computed for all instantaneous spectra between the start and the end of each element. The mean value of all these individual measurement values is calculated. The peak frequency applied to this location is also referred to as the mean peak frequency.
Peak frequency measure applied to the locations Min, Max and Mean param. of entire element
In case the elements contain soft intervals or silent breaks, the Min/Max/Mean param. of entire element measurements can be distorted by the background noise (interpreting the background noise as a signal and thereefore providing wrong results). This can be avoided by activating the
Reject if peak ampl. < xx dB option and adjusting the dB threshold in such a way that the noise is rejected but the vocalizations are still detected.
Relative stddev of entire element The spectrum-based parameters are internally computed for all instantaneous spectra between the start and the end of each element and the relative standard deviation ( = standard deviation / mean value) of these parameters is calculated. This parameter can be used for instance for quantifying frequency or amplitude modulation.
Regular intervals of xxx ms The spectrum-based parameters are computed repeatedly at regular intervals within each element. The interval is specified in milliseconds. The time resolution of the spectrogram must be adapted to the desired measurement interval. The maximum number of samples within each element will be limited to the specified max entries.
Regular intervals of duration / n The spectrum-based parameters are computed repeatedly at regular intervals within each element. The number of measurements taken per element is specified here. The absolute time interval will therefore depend on the duration of each element.
more... This button launches a separate dialog box for selecting additional parameters
Reject if peak ampl. < xx dB When this option is activated, the spectrum-based parameters will be rejected at those locations where the peak amplitude of the corresponding instantaneous spectrum is lower than the specified threshold. If the rejection threshold has been adjusted properly this option can certainly improve the reliability of the parameters peak freq(minentire) and peak freq(maxentire) in sound elements that exhibit short silent breaks due to superposition of direct and reflected sounds (which would otherwise cause incorrect results).
Exclude rejected elements from results table If activated, the elements rejected by the above option Reject if peak ampl. will be excluded completely from the results table. Otherwise the corresponding rows will still appear on the list with blank measurement fields.
The unit of all temporal measurements is seconds. The unit of all frequency measurements is Hz.
Derived parameters In order to extend the classification (and measurement) facilities it is possible to derive more complex parameters from the original measurements for each detected element.
Use the Settings... button to configure this tool.
Post filter on elements
enable This option activates two additional filter criterions that can reject unwanted sound elements that are shorter than the specified limit and/or that have a broad-band frequency spectrum (noise signals). This filter is certainly useful for eliminating short (broad-band) cracks caused by the activity (movement) of caged animals. This option should be initially disabled during the process of optimizing the element separation (adjusting thresholds and hold time) because it might otherwise disguise the operation of the primary element separation/detection mechanism.
min duration Elements shorter than this limit will be rejected.
max entropy Elements whose minimum Wiener entropy is higher than this limit (noisy signals having a weak harmonic structure) will be rejected. Whistle-like sounds usually have a low entropy (<0.3), while broad-band (noisy) sounds have higher entropies (>0.4). During the process of optimizing the entropy threshold setting, it might be useful to temporarily activate the Spectrum-based parameter entropy at Min param. of entire element to get an idea of the entropy properties of both the wanted and unwanted sounds.
add filename If activated, the name of the current sound file will be added to the results list. The related option each row will add the filename to every row - otherwise it will only be added to the first (element) row.
The option with path will include the entire pathname.
Presets
whistles Selects appropriate default settings for measuring pure-tone, whistle-like vocalizations
barks Selects appropriate default settings for measuring noisy barks
Classification
Enable If this option is activated, the detected elements will be classified according to the settings on the Classification Settings dialog box.
Settings... This button launches the Classification Settings dialog box.
Response...
This button launches the Automatic Response Settings dialog box.
If the option Show numeric results is activated, the results will be shown in a separate results window.
The Default button returns to the default settings.
The << button hides the parameter derfinition section of the dialog box.
The >> button shows the parameter definition section.
|
|