
SASLab Manual
| |
Curve window: Display > 3D Options
|
|
The 3D Display Options dialog box allows customizing XYZ plots. Right clicking at the graph or the drop-down menu item Display > 3D Options... will launch this dialog box.
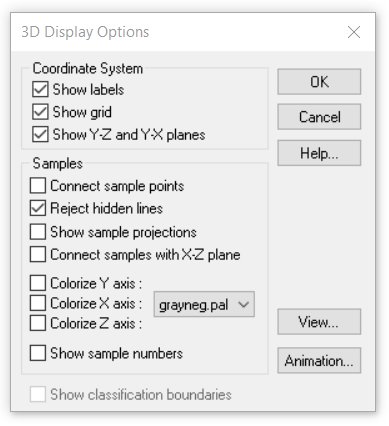
Coordinate System
Show labels
Show grid
Show Y-Z and Y-X planes
Samples
Connect sample points
Connects consecutive samples with straight lines.
Reject hidden lines
If this option is activated, any lines theoretically not visible on the 3D surface from the current point of view will be hidden. Otherwise the 'hidden' lines will be displayed.
Show sample projections
Shows a perpendicular projection of each sample to all three planes (Y-X, Y-Z, X-Z)
Connect samples with X-Z plane
This option will draw a perpendicular line from the sample to the X-Z plane.
Colorize Y axis, Colorize X axis, Colorize Z axis
Activating one of the Colorize options will display the sample points in different colors depending on the value of the corresponding coordinate. The display range is divided into 16 equally spaced color sections. The list box behind allows choosing the desired color table.
Show sample numbers
This option shows the number (index) of each sample, which can be useful for identifying samples on scatter plots. Don’t use this option for 3D spectrographs or other extensive data sets.
View... This button launches the Display Range dialog box.
Animation... This button launches the 3D Animation dialog box.
|
|