
SASLab Manual
| |
Spectrogram window : File > Export Parameters
|
|
The format of the spectrograms exported through the commands File > Save Spectrogram or File > Copy Spectrogram can be defined from the Spectrogram Export Parameters dialog box.
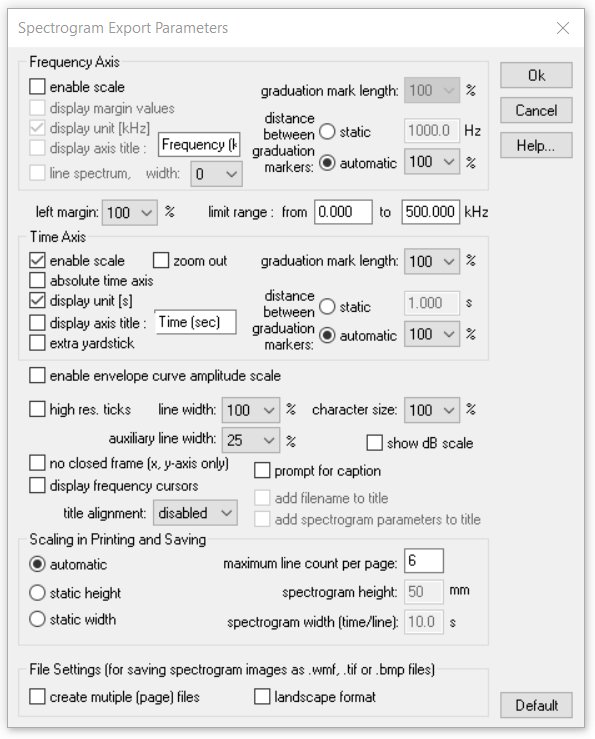
Frequency Axis
enable scale Activates the labeled frequency axis scale.
display margin values Shows the zero label on the frequency axis scale.
display unit [kHz] Shows the unit label on the frequency axis.
display axis title The axis title will be shown (as defined in the text field).
line spectrum If the single/mean (power) spectrum is activated from Additional Spectrogram Information and this option is activated, the spectrum is represented as a set of separated spectral lines. Otherwise, the spectrum is plotted as a continuous curve. The width parameter determines the line width of the spectrum and waveform displays on .wmf formatted images. If a solid (filled) spectrum is desired, increase the width parameter until the desired result is achieved.
graduation mark length Relative length of the graduation markers (axis ticks) in percent of the standard length. This setting applies to the WMF format only (it has no effect on BMP, TIFF and PNG formatted images).
The distance between graduation markers can either be set to a static value or it can be adjusted automatically when the option automatic is selected. The automatic scaling can be influenced by selecting a percentage of the standard distance.
left margin Relative size of the left margin. Increase this parameter if you need to change the aspect ratio of the pasted .wmf spectrogram images, which can prevent cutting the frequency axis labels.
limit range from ... to ... kHz The normal frequency range of a spectrogram goes from zero to half of the sampling frequency of the underlying sound file. The frequency range that can be specified here will limit that range for the spectrogram output.
Time Axis
enable scale Activates the labeled time axis scale.
absolute time axis If activated, the absolute time axis scaling is maintained when exporting a marked subsection of the spectrogram. If this option is not activated, the time axis start will always start at zero.
display unit [s] The unit label of the time axis is displayed.
display axis title The axis title will be shown (as defined in the text field).
extra yardstick An extra yardstick (time scale) is displayed inside the spectrogram. This is especially useful for very short spectrograms when the space is limited for the standard time scale at the bottom of the spectrogram.
zoom out If activated, the Tools > zoom out time axis settings will also be used for the exported spectrograms. If this option is not activated, the spectrogram will be exported in its original resolution without applying the zoom out settings.
graduation mark length Relative length of the graduation markers (time axis ticks) in percent of the standard length. This setting applies to the WMF format only (it has no effect on BMP, TIFF and PNG formatted images).
The distance between graduation markers can either be set to a static value or it can be adjusted automatically when the option automatic is selected. The automatic scaling can be influenced by selecting a percentage of the standard distance.
enable envelope curve amplitude scale Shows the envelope curve (waveform) amplitude scale. This option is only available when the Time Axis / Envelope Curve option has been activated from the command Display > Additional Spectrogram Information.
high res. ticks If this option is activated, additional small graduation markers (ticks) without labels will be displayed.
line width Relative width of the spectrogram frame and the graduation markers in percent of the standard width.
auxiliary line width Relative line width of the grid, labels and the high res. ticks.
character size Relative character size in percent of the standard size.
show dB scale: The color mapping of the spectrogram magnitudes will be added.
no closed frame (only x and y axis) If this option is activated the spectrogram will exhibit only the x and y axis (omitting the closed frame at the top and right-hand side).
display frequency cursors If this option is activated, the currently active frequency cursors (except reticule cursors) will be displayed on the exported spectrogram.
Prompt for caption If activated, a caption text input box will be launched before the spectrogram is saved or copied into the clipboard. The specified text will then be added to the spectrogram image.
Title alignment Position of the sound file title at the top of the display. Possible options are left, center, right and disabled if the current title should not appear. The sound file title can be specified from the Label settings dialog box.
Add filename to title If this option is activated and the title alignment is not disabled, the filename of the sound file will be displayed at the top of the spectrogram.
Add spectrogram parameters to title If this option is activated and the title alignment is not disabled, the spectrogram parameter settings (FFT length, frame size, windows type and bandwidth) will be displayed at the top of the spectrogram.
Scaling in Printing and Saving
automatic The spectrogram size is selected automatically based on the full-page size. The spectrogram scaling on the exported page depends therefore on the length of the spectrogram.
maximum line count per page When the spectrogram is printed from the command File > Print entire spectrogram > several lines and the option automatic has been selected, the specified value limits the maximum number of spectrogram lines (rows) printed on a page. Depending on the specified value and the amount of data, the spectrogram will be printed on more than one page.
static height The spectrogram size is adjusted to the specified spectrogram height independently of the spectrogram length. Depending on the specified value and the amount of data, the spectrogram will be printed on more than one page.
static width When the spectrogram is printed using the command File > Print entire spectrogram > several lines and the option static width is selected, each line of the multiple line spectrogram is set to the duration specified in the spectrogram width (time/line). Depending on the specified value and the amount of data, the spectrogram will be printed on more than one page.
File Settings (for saving spectrogram images as .wmf, .tif or .bmp files)
This section applies to the command File > Save Entire Spectrogram Image > several lines....
If the option create multiple (page) files is activated, the software will output more than one file if necessary. It is recommended to activate this option for saving long spectrograms (otherwise, the resulting spectrograms would be very large with tiny rows or the software might even crash due to the large file sizes. The multiple output files are identified by the additional filename extension _pageXX. The dimensions of the image files are determined by the settings defined in the above section Scaling in Printing and Saving.
landscape format If activated, the output will be in landscape format rather than the defaulkt portrait format.
Default This button provides the default settings.
|
|