
SASLab Manual
| |
Main window : Tools > Labels > Label statistics
|
|
This dialog box displays some statistics on the temporal properties of the labels (interval, duration and break duration).
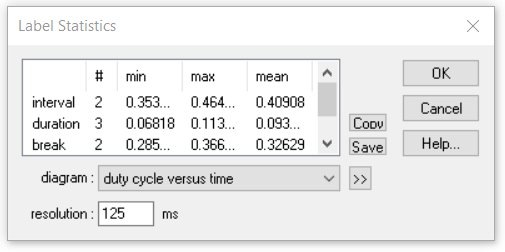
Min, max and mean of the intervals between the labels are calculated from all kind of labels (both time-frequency and section labels), while the durations and the breaks can only be determined for section labels.
The break is measured from the end to the start of the next section label. The measurements on section labels will only be valid as long as they do not overlap. The measurements table can be exported either via the clipboard (Copy button) or via a text file (Save button).
The diagram list box allows to select one of the following diagrams:
histogram of intervals
histogram of durations
histogram of breaks
pulse density versus time This option counts the number of labels (both single-point and section labels) that occur within each time frame (frame size = resolution). In section labels, the starts
duty cycle versus time
This option determines the duty cycles (the normalized on time) for each time frame (frame size = resolution).
For instance, if there were a single section label that lasts for 20 ms and falls entirely into a single time frame (resolution = 100 ms),
then the duty cycle would be 20% in the time interval where the label is. All other intervals were zero. In order to get smooth results,
the resolution value should be significantly larger than the durations of the labels. The duty cycle can only be determined for section labels
(time-frequency labels have no duration that could be analyzed).
Copy Copies the table into the clipboard.
Saves the tabel as a .txt file.
Use the >> button to display the selected diagram (OK will instead close the dialog box and also launch the selected diagram).
The resolution edit box determines the temporal resolution of the diagrams.
|
|