
SASLab Manual
| |
Spectrogram window : Tools > Automatic parameter measurements > Results window
|
|
The results of the automatic parameter measurements will be shown in a separate numeric display window if the option Show numeric results on the Automatic Parameter Measurements setup dialog box has been activated.
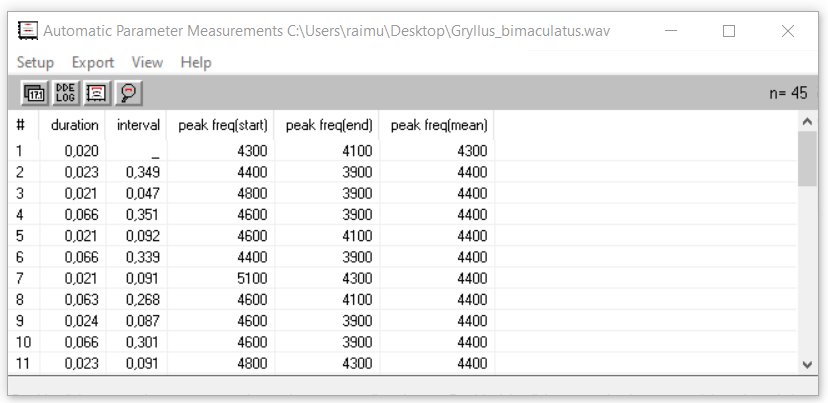
All parameters selected on the setup dialog box will be displayed on a table. The measurement values of the individual elements are listed in a separate row. The columns represent the different parameter measurements. The running element number is displayed in the first column.
Double-clicking at a list entry will move the spectrogram view to this element.
Setup
Automatic parameter measurements setup... 
Classification settings...
Statistics settings...
Automatic Response Setup...
Export
Copy parameter measurement values  Copies the parameter measurement values of the marked or visible section into the clipboard. Optionally these values will be transferred by DDE or will be written into a LOG file (File > Data export > DDE Parameters / Log-File). Copies the parameter measurement values of the marked or visible section into the clipboard. Optionally these values will be transferred by DDE or will be written into a LOG file (File > Data export > DDE Parameters / Log-File).
Copy parameter measurement values for entire file Copies the parameter measurement values of the entire spectrogram (spectrogram (not only the visible section) into the clipboard. Optionally these values will be transferred by DDE or will be written into a LOG file (File > Data export > DDE Parameters / Log-File).
Copy parameter measurement values in transposed order Copies the parameter measurement values that are currently visible on the numeric display window in transposed order (rows and columns reversed) into the clipboard.
Copy parameter measurement statistics Copies the statistics values into the clipboard.
Copy parameter measurement headings Copies the headings for the currently activated parameters into the clipboard. This supports navigation through the exported measurement values. Optionally these headings will be transferred by DDE or will be written into a LOG file (File > Data export > DDE Parameters / Log-File).
Copy class sequence Copies the names of the detected classes into the clipboard (in ASCII format).
Example: A B B A C C C B
Copy class frequency The number of elements associated to each class is counted. The result is copied into the clipboard (in ASCII format).
Example:
A 2
B 3
C 3
n= 8
Save detected elements into numbered .wav files...
Remove gaps between detected elements...
Delete gaps between detected elements...
Copy detected elements into section labels...
Copy peak frequencies into labels Labels indicating the peak frequencies at the selected Location of measurements will be created. The last label of each element will be marked with a dot (period) in the label text. This enables the subsequent grouped export of labels (Tools/Labels/Export label data
). In this way, it is for instance possible to export frequency contours that have been edited manually (the created labels can be moved prior to exporting them).
DDE Parameters / Log-File...
View
Show the selected element on the spectrogram window This command moves the spectrogram window view to the element that is currently selected on the list.
Synchronize the numeric and the spectrographic view This option connects the scroll bars of the numeric and the spectrographic display views.
Remove currently selected label
|
|