
SASLab Manual
| |
Main window : File > Real-Time Spectrum
|
|
The real-time spectrum display is launched from the main window drop-down menu File > Real-time spectrum....
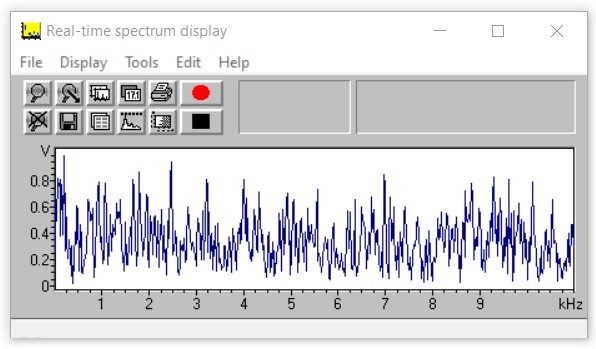
It is basically a curve window with a number of additional options.
The real time display can be started from the drop-down menu File > Start real time spectrum or by clicking at the  button. button.
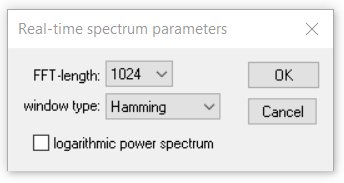
The drop-down menu item File > Real time spectrum setup allows to set the FFT length, window type and whether the magnitude should be displayed in logarithmic or linear scale (option logarithmic power spectrum):
|
|